Annual Report of the Department of Health 2010 - Unrwa
Annual Report of the Department of Health 2010 - Unrwa
Annual Report of the Department of Health 2010 - Unrwa

Create successful ePaper yourself
Turn your PDF publications into a flip-book with our unique Google optimized e-Paper software.
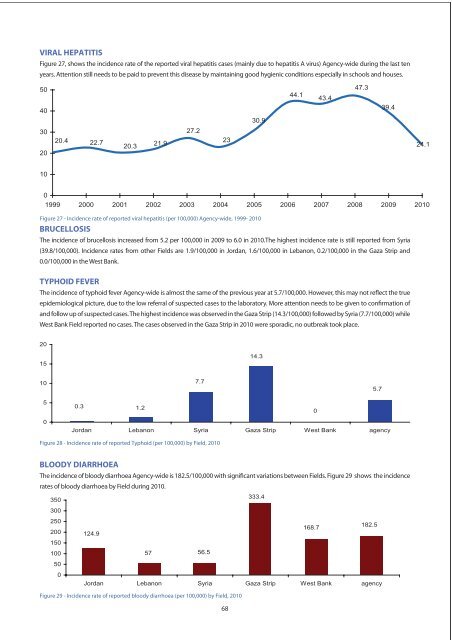
VIRAL HEPATITIS<br />
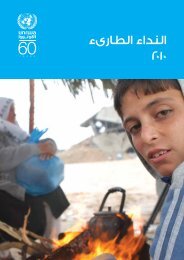
Figure 27, shows <strong>the</strong> incidence rate <strong>of</strong> <strong>the</strong> reported viral hepatitis cases (mainly due to hepatitis A virus) Agency-wide during <strong>the</strong> last ten<br />
years. Attention still needs to be paid to prevent this disease by maintaining good hygienic conditions especially in schools and houses.<br />
50<br />
44.1<br />
43.4<br />
47.3<br />
40<br />
39.4<br />
30.9<br />
30<br />
27.2<br />
20<br />
20.4 22.7<br />
20.3<br />
21.9<br />
23<br />
24.1<br />
10<br />
0<br />
1999 2000 2001 2002 2003 2004 2005 2006 2007 2008 2009 <strong>2010</strong><br />
Figure 27 - Incidence rate <strong>of</strong> reported viral hepatitis (per 100,000) Agency-wide, 1999- <strong>2010</strong><br />
BRUCELLOSIS<br />
The incidence <strong>of</strong> brucellosis increased from 5.2 per 100,000 in 2009 to 6.0 in <strong>2010</strong>.The highest incidence rate is still reported from Syria<br />
(39.8/100,000). Incidence rates from o<strong>the</strong>r Fields are 1.9/100,000 in Jordan, 1.6/100,000 in Lebanon, 0.2/100,000 in <strong>the</strong> Gaza Strip and<br />
0.0/100,000 in <strong>the</strong> West Bank.<br />
TYPHOID FEVER<br />
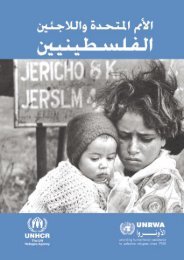
The incidence <strong>of</strong> typhoid fever Agency-wide is almost <strong>the</strong> same <strong>of</strong> <strong>the</strong> previous year at 5.7/100,000. However, this may not reflect <strong>the</strong> true<br />
epidemiological picture, due to <strong>the</strong> low referral <strong>of</strong> suspected cases to <strong>the</strong> laboratory. More attention needs to be given to confirmation <strong>of</strong><br />
and follow up <strong>of</strong> suspected cases. The highest incidence was observed in <strong>the</strong> Gaza Strip (14.3/100,000) followed by Syria (7.7/100,000) while<br />
West Bank Field reported no cases. The cases observed in <strong>the</strong> Gaza Strip in <strong>2010</strong> were sporadic, no outbreak took place.<br />
20<br />
15<br />
14.3<br />
10<br />
7.7<br />
5.7<br />
5<br />
0.3 1.2<br />
0<br />
0<br />
Jordan Lebanon Syria Gaza Strip West Bank agency<br />
Figure 28 - Incidence rate <strong>of</strong> reported Typhoid (per 100,000) by Field, <strong>2010</strong><br />
BLOODY DIARRHOEA<br />
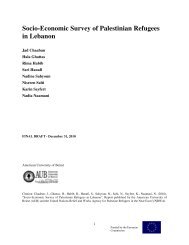
The incidence <strong>of</strong> bloody diarrhoea Agency-wide is 182.5/100,000 with significant variations between Fields. Figure 29 shows <strong>the</strong> incidence<br />
rates <strong>of</strong> bloody diarrhoea by Field during <strong>2010</strong>.<br />
333.4<br />
350<br />
300<br />
250<br />
200<br />
124.9<br />
168.7<br />
182.5<br />
150<br />
100<br />
57 56.5<br />
50<br />
0<br />
Jordan Lebanon Syria Gaza Strip West Bank agency<br />
Figure 29 - Incidence rate <strong>of</strong> reported bloody diarrhoea (per 100,000) by Field, <strong>2010</strong><br />
68