Annual Report of the Department of Health 2010 - Unrwa
Annual Report of the Department of Health 2010 - Unrwa
Annual Report of the Department of Health 2010 - Unrwa

You also want an ePaper? Increase the reach of your titles
YUMPU automatically turns print PDFs into web optimized ePapers that Google loves.
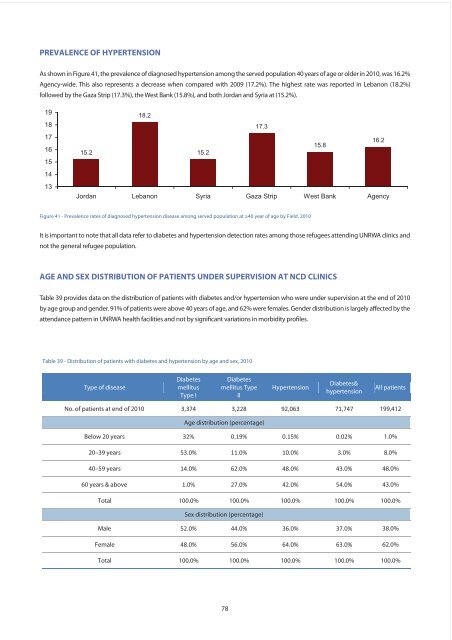
PREVALENCE OF HYPERTENSION<br />
As shown in Figure 41, <strong>the</strong> prevalence <strong>of</strong> diagnosed hypertension among <strong>the</strong> served population 40 years <strong>of</strong> age or older in <strong>2010</strong>, was 16.2%<br />
Agency-wide. This also represents a decrease when compared with 2009 (17.2%). The highest rate was reported in Lebanon (18.2%)<br />
followed by <strong>the</strong> Gaza Strip (17.3%), <strong>the</strong> West Bank (15.8%), and both Jordan and Syria at (15.2%).<br />
19<br />
18<br />
17<br />
16<br />
15<br />
14<br />
13<br />
18.2<br />
17.3<br />
15.8<br />
16.2<br />
15.2<br />
15.2<br />
Jordan Lebanon Syria Gaza Strip West Bank Agency<br />
Figure 41 - Prevalence rates <strong>of</strong> diagnosed hypertension disease among served population at ≥40 year <strong>of</strong> age by Field, <strong>2010</strong><br />
It is important to note that all data refer to diabetes and hypertension detection rates among those refugees attending UNRWA clinics and<br />
not <strong>the</strong> general refugee population.<br />
AGE AND SEX DISTRIBUTION OF PATIENTS UNDER SUPERVISION AT NCD CLINICS<br />
Table 39 provides data on <strong>the</strong> distribution <strong>of</strong> patients with diabetes and/or hypertension who were under supervision at <strong>the</strong> end <strong>of</strong> <strong>2010</strong><br />
by age group and gender. 91% <strong>of</strong> patients were above 40 years <strong>of</strong> age, and 62% were females. Gender distribution is largely affected by <strong>the</strong><br />
attendance pattern in UNRWA health facilities and not by significant variations in morbidity pr<strong>of</strong>iles.<br />
Table 39 - Distribution <strong>of</strong> patients with diabetes and hypertension by age and sex, <strong>2010</strong><br />
Type <strong>of</strong> disease<br />
Diabetes<br />
mellitus<br />
Type I<br />
Diabetes<br />
mellitus Type<br />
II<br />
Hypertension<br />
Diabetes&<br />
hypertension<br />
All patients<br />
No. <strong>of</strong> patients at end <strong>of</strong> <strong>2010</strong> 3,374 3,228 92,063 71,747 199,412<br />
Age distribution (percentage)<br />
Below 20 years 32% 0.19% 0.15% 0.02% 1.0%<br />
20–39 years 53.0% 11.0% 10.0% 3.0% 8.0%<br />
40–59 years 14.0% 62.0% 48.0% 43.0% 48.0%<br />
60 years & above 1.0% 27.0% 42.0% 54.0% 43.0%<br />
Total 100.0% 100.0% 100.0% 100.0% 100.0%<br />
Sex distribution (percentage)<br />
Male 52.0% 44.0% 36.0% 37.0% 38.0%<br />
Female 48.0% 56.0% 64.0% 63.0% 62.0%<br />
Total 100.0% 100.0% 100.0% 100.0% 100.0%<br />
78