Pre-Lab 13 Assignment: Radioactive Decay
Pre-Lab 13 Assignment: Radioactive Decay
Pre-Lab 13 Assignment: Radioactive Decay
You also want an ePaper? Increase the reach of your titles
YUMPU automatically turns print PDFs into web optimized ePapers that Google loves.
<strong>Radioactive</strong> <strong>Decay</strong> v 0.1<br />
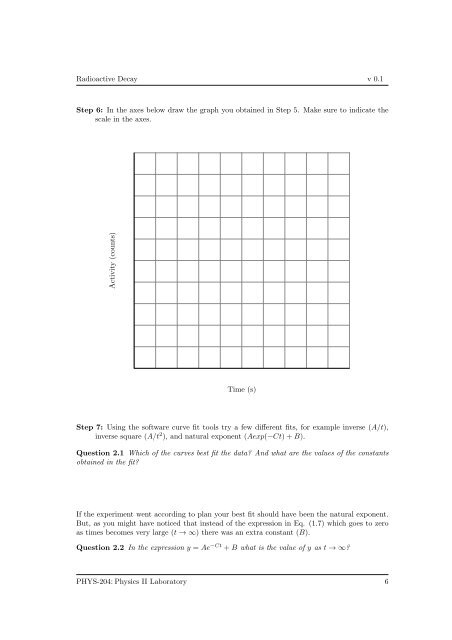
Step 6: In the axes below draw the graph you obtained in Step 5. Make sure to indicate the<br />
scale in the axes.<br />
Activity (counts)<br />
Time (s)<br />
Step 7: Using the software curve fit tools try a few different fits, for example inverse (A/t),<br />
inverse square (A/t 2 ), and natural exponent (Aexp(−Ct)+B).<br />
Question 2.1 Which of the curves best fit the data? And what are the values of the constants<br />
obtained in the fit?<br />
If the experiment went according to plan your best fit should have been the natural exponent.<br />
But, as you might have noticed that instead of the expression in Eq. (1.7) which goes to zero<br />
as times becomes very large (t → ∞) there was an extra constant (B).<br />
Question 2.2 In the expression y = Ae −Ct +B what is the value of y as t → ∞?<br />
PHYS-204:Physics II <strong>Lab</strong>oratory 6


