CONSOLIDATED PLAN & STRATEGY 5-YEAR ... - City of Lakeland
CONSOLIDATED PLAN & STRATEGY 5-YEAR ... - City of Lakeland
CONSOLIDATED PLAN & STRATEGY 5-YEAR ... - City of Lakeland

You also want an ePaper? Increase the reach of your titles
YUMPU automatically turns print PDFs into web optimized ePapers that Google loves.
<strong>Lakeland</strong> 1,182 3.5 208 0.6 250 0.6 116 0.3<br />
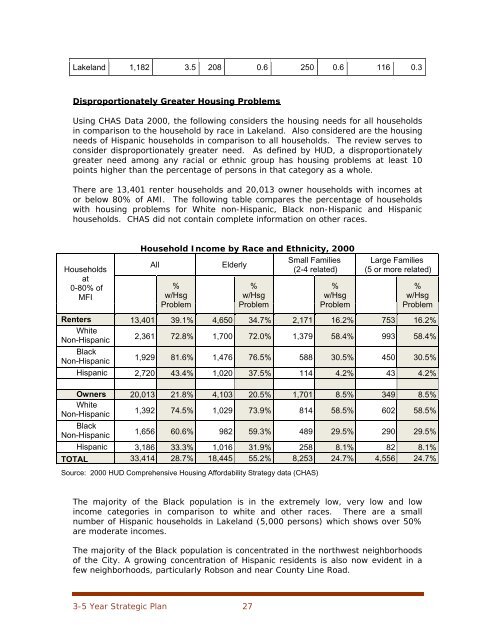
Disproportionately Greater Housing Problems<br />
Using CHAS Data 2000, the following considers the housing needs for all households<br />
in comparison to the household by race in <strong>Lakeland</strong>. Also considered are the housing<br />
needs <strong>of</strong> Hispanic households in comparison to all households. The review serves to<br />
consider disproportionately greater need. As defined by HUD, a disproportionately<br />
greater need among any racial or ethnic group has housing problems at least 10<br />
points higher than the percentage <strong>of</strong> persons in that category as a whole.<br />
There are 13,401 renter households and 20,013 owner households with incomes at<br />
or below 80% <strong>of</strong> AMI. The following table compares the percentage <strong>of</strong> households<br />
with housing problems for White non-Hispanic, Black non-Hispanic and Hispanic<br />
households. CHAS did not contain complete information on other races.<br />
Households<br />
at<br />
0-80% <strong>of</strong><br />
MFI<br />
Household Income by Race and Ethnicity, 2000<br />
Small Families<br />
All<br />
Elderly<br />
(2-4 related)<br />
%<br />
w/Hsg<br />
Problem<br />
%<br />
w/Hsg<br />
Problem<br />
%<br />
w/Hsg<br />
Problem<br />
Large Families<br />
(5 or more related)<br />
%<br />
w/Hsg<br />
Problem<br />
Renters 13,401 39.1% 4,650 34.7% 2,171 16.2% 753 16.2%<br />
White<br />
Non-Hispanic<br />
2,361 72.8% 1,700 72.0% 1,379 58.4% 993 58.4%<br />
Black<br />
Non-Hispanic<br />
1,929 81.6% 1,476 76.5% 588 30.5% 450 30.5%<br />
Hispanic 2,720 43.4% 1,020 37.5% 114 4.2% 43 4.2%<br />
Owners 20,013 21.8% 4,103 20.5% 1,701 8.5% 349 8.5%<br />
White<br />
Non-Hispanic<br />
1,392 74.5% 1,029 73.9% 814 58.5% 602 58.5%<br />
Black<br />
Non-Hispanic<br />
1,656 60.6% 982 59.3% 489 29.5% 290 29.5%<br />
Hispanic 3,186 33.3% 1,016 31.9% 258 8.1% 82 8.1%<br />
TOTAL 33,414 28.7% 18,445 55.2% 8,253 24.7% 4,556 24.7%<br />
Source: 2000 HUD Comprehensive Housing Affordability Strategy data (CHAS)<br />
The majority <strong>of</strong> the Black population is in the extremely low, very low and low<br />
income categories in comparison to white and other races. There are a small<br />
number <strong>of</strong> Hispanic households in <strong>Lakeland</strong> (5,000 persons) which shows over 50%<br />
are moderate incomes.<br />
The majority <strong>of</strong> the Black population is concentrated in the northwest neighborhoods<br />
<strong>of</strong> the <strong>City</strong>. A growing concentration <strong>of</strong> Hispanic residents is also now evident in a<br />
few neighborhoods, particularly Robson and near County Line Road.<br />
3-5 Year Strategic Plan 27