CONSOLIDATED PLAN & STRATEGY 5-YEAR ... - City of Lakeland
CONSOLIDATED PLAN & STRATEGY 5-YEAR ... - City of Lakeland
CONSOLIDATED PLAN & STRATEGY 5-YEAR ... - City of Lakeland

You also want an ePaper? Increase the reach of your titles
YUMPU automatically turns print PDFs into web optimized ePapers that Google loves.
Notes:<br />
[1] Does not include all units. Excludes mobile homes in mobile home parks.<br />
* -100 means less than 25 observations.<br />
* -200 means less than 2/3 <strong>of</strong> observations have valid year built entries.<br />
* -300 means less than 2/3 <strong>of</strong> observations have valid square footage entries.<br />
* -400 means no observations.<br />
Sources: County property appraiser tax rolls, compiled by Shimberg Center - Florida Housing Data Clearinghouse.<br />
See most recent State <strong>of</strong> Florida Housing Report for further explanation <strong>of</strong> terms.<br />
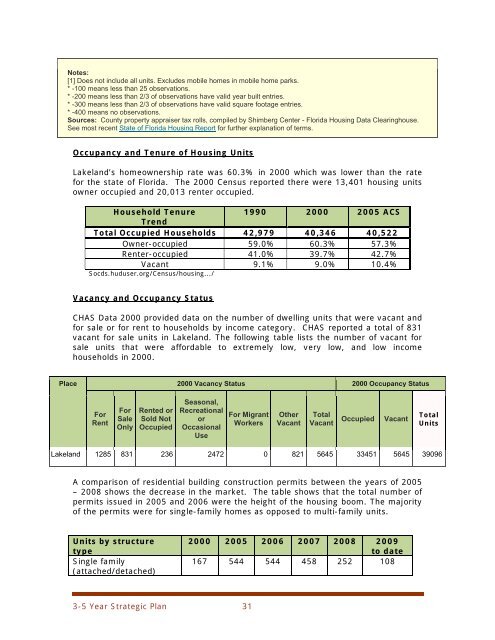
Occupancy and Tenure <strong>of</strong> Housing Units<br />
<strong>Lakeland</strong>’s homeownership rate was 60.3% in 2000 which was lower than the rate<br />
for the state <strong>of</strong> Florida. The 2000 Census reported there were 13,401 housing units<br />
owner occupied and 20,013 renter occupied.<br />
Household Tenure<br />
1990 2000 2005 ACS<br />
Trend<br />
Total Occupied Households 42,979 40,346 40,522<br />
Owner-occupied 59.0% 60.3% 57.3%<br />
Renter-occupied 41.0% 39.7% 42.7%<br />
Vacant 9.1% 9.0% 10.4%<br />
Socds.huduser.org/Census/housing.../<br />
Vacancy and Occupancy Status<br />
CHAS Data 2000 provided data on the number <strong>of</strong> dwelling units that were vacant and<br />
for sale or for rent to households by income category. CHAS reported a total <strong>of</strong> 831<br />
vacant for sale units in <strong>Lakeland</strong>. The following table lists the number <strong>of</strong> vacant for<br />
sale units that were affordable to extremely low, very low, and low income<br />
households in 2000.<br />
Place 2000 Vacancy Status 2000 Occupancy Status<br />
For<br />
Rent<br />
For<br />
Sale<br />
Only<br />
Rented or<br />
Sold Not<br />
Occupied<br />
Seasonal,<br />
Recreational<br />
or<br />
Occasional<br />
Use<br />
For Migrant<br />
Workers<br />
Other<br />
Vacant<br />
Total<br />
Vacant<br />
Occupied<br />
Vacant<br />
Total<br />
Units<br />
<strong>Lakeland</strong> 1285 831 236 2472 0 821 5645 33451 5645 39096<br />
A comparison <strong>of</strong> residential building construction permits between the years <strong>of</strong> 2005<br />
– 2008 shows the decrease in the market. The table shows that the total number <strong>of</strong><br />
permits issued in 2005 and 2006 were the height <strong>of</strong> the housing boom. The majority<br />
<strong>of</strong> the permits were for single-family homes as opposed to multi-family units.<br />
Units by structure<br />
type<br />
Single family<br />
(attached/detached)<br />
2000 2005 2006 2007 2008 2009<br />
to date<br />
167 544 544 458 252 108<br />
3-5 Year Strategic Plan 31