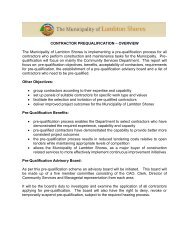
View - The Municipality of Lambton Shores
View - The Municipality of Lambton Shores
View - The Municipality of Lambton Shores

You also want an ePaper? Increase the reach of your titles
YUMPU automatically turns print PDFs into web optimized ePapers that Google loves.
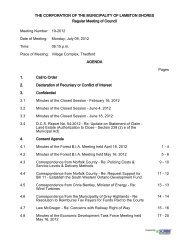
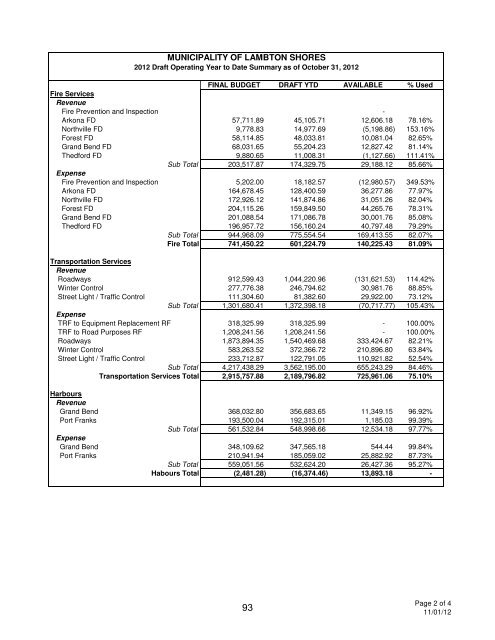
MUNICIPALITY OF LAMBTON SHORES<br />
2012 Draft Operating Year to Date Summary as <strong>of</strong> October 31, 2012<br />
FINAL BUDGET DRAFT YTD AVAILABLE % Used<br />
Fire Services<br />
Revenue<br />
Fire Prevention and Inspection -<br />
Arkona FD 57,711.89 45,105.71 12,606.18 78.16%<br />
Northville FD 9,778.83 14,977.69 (5,198.86) 153.16%<br />
Forest FD 58,114.85 48,033.81 10,081.04 82.65%<br />
Grand Bend FD 68,031.65 55,204.23 12,827.42 81.14%<br />
<strong>The</strong>dford FD 9,880.65 11,008.31 (1,127.66) 111.41%<br />
Sub Total 203,517.87 174,329.75 29,188.12 85.66%<br />
Expense<br />
Fire Prevention and Inspection 5,202.00 18,182.57 (12,980.57) 349.53%<br />
Arkona FD 164,678.45 128,400.59 36,277.86 77.97%<br />
Northville FD 172,926.12 141,874.86 31,051.26 82.04%<br />
Forest FD 204,115.26 159,849.50 44,265.76 78.31%<br />
Grand Bend FD 201,088.54 171,086.78 30,001.76 85.08%<br />
<strong>The</strong>dford FD 196,957.72 156,160.24 40,797.48 79.29%<br />
Sub Total 944,968.09 775,554.54 169,413.55 82.07%<br />
Fire Total 741,450.22 601,224.79 140,225.43 81.09%<br />
Transportation Services<br />
Revenue<br />
Roadways 912,599.43 1,044,220.96 (131,621.53) 114.42%<br />
Winter Control 277,776.38 246,794.62 30,981.76 88.85%<br />
Street Light / Traffic Control 111,304.60 81,382.60 29,922.00 73.12%<br />
Sub Total 1,301,680.41 1,372,398.18 (70,717.77) 105.43%<br />
Expense<br />
TRF to Equipment Replacement RF 318,325.99 318,325.99 - 100.00%<br />
TRF to Road Purposes RF 1,208,241.56 1,208,241.56 - 100.00%<br />
Roadways 1,873,894.35 1,540,469.68 333,424.67 82.21%<br />
Winter Control 583,263.52 372,366.72 210,896.80 63.84%<br />
Street Light / Traffic Control 233,712.87 122,791.05 110,921.82 52.54%<br />
Sub Total 4,217,438.29 3,562,195.00 655,243.29 84.46%<br />
Transportation Services Total 2,915,757.88 2,189,796.82 725,961.06 75.10%<br />
Harbours<br />
Revenue<br />
Grand Bend 368,032.80 356,683.65 11,349.15 96.92%<br />
Port Franks 193,500.04 192,315.01 1,185.03 99.39%<br />
Sub Total 561,532.84 548,998.66 12,534.18 97.77%<br />
Expense<br />
Grand Bend 348,109.62 347,565.18 544.44 99.84%<br />
Port Franks 210,941.94 185,059.02 25,882.92 87.73%<br />
Sub Total 559,051.56 532,624.20 26,427.36 95.27%<br />
Habours Total (2,481.28) (16,374.46) 13,893.18 -<br />
93<br />
Page 2 <strong>of</strong> 4<br />
11/01/12