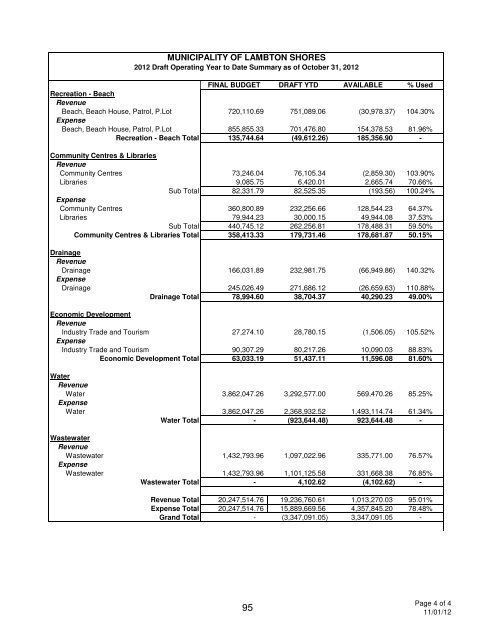
MUNICIPALITY OF LAMBTON SHORES 2012 Draft Operating Year to Date Summary as <strong>of</strong> October 31, 2012 FINAL BUDGET DRAFT YTD AVAILABLE % Used Recreation - Beach Revenue Beach, Beach House, Patrol, P.Lot 720,110.69 751,089.06 (30,978.37) 104.30% Expense Beach, Beach House, Patrol, P.Lot 855,855.33 701,476.80 154,378.53 81.96% Recreation - Beach Total 135,744.64 (49,612.26) 185,356.90 - Community Centres & Libraries Revenue Community Centres 73,246.04 76,105.34 (2,859.30) 103.90% Libraries 9,085.75 6,420.01 2,665.74 70.66% Sub Total 82,331.79 82,525.35 (193.56) 100.24% Expense Community Centres 360,800.89 232,256.66 128,544.23 64.37% Libraries 79,944.23 30,000.15 49,944.08 37.53% Sub Total 440,745.12 262,256.81 178,488.31 59.50% Community Centres & Libraries Total 358,413.33 179,731.46 178,681.87 50.15% Drainage Revenue Drainage 166,031.89 232,981.75 (66,949.86) 140.32% Expense Drainage 245,026.49 271,686.12 (26,659.63) 110.88% Drainage Total 78,994.60 38,704.37 40,290.23 49.00% Economic Development Revenue Industry Trade and Tourism 27,274.10 28,780.15 (1,506.05) 105.52% Expense Industry Trade and Tourism 90,307.29 80,217.26 10,090.03 88.83% Economic Development Total 63,033.19 51,437.11 11,596.08 81.60% Water Revenue Water 3,862,047.26 3,292,577.00 569,470.26 85.25% Expense Water 3,862,047.26 2,368,932.52 1,493,114.74 61.34% Water Total - (923,644.48) 923,644.48 - Wastewater Revenue Wastewater 1,432,793.96 1,097,022.96 335,771.00 76.57% Expense Wastewater 1,432,793.96 1,101,125.58 331,668.38 76.85% Wastewater Total - 4,102.62 (4,102.62) - Revenue Total 20,247,514.76 19,236,760.61 1,013,270.03 95.01% Expense Total 20,247,514.76 15,889,669.56 4,357,845.20 78.48% Grand Total - (3,347,091.05) 3,347,091.05 - 95 Page 4 <strong>of</strong> 4 11/01/12
<strong>Municipality</strong> <strong>of</strong> <strong>Lambton</strong> <strong>Shores</strong> 2012 Capital Expense Summary October 31, 2012 PROJECT TOTAL 2012 FINAL BUDGET 2012 EXPENSES TOTAL PROJECT EXPENSE COMMENTS GENERAL GB Office 2-110-110-5879 Facility Upgrades 26,443.43 1,134.79 1,134.79 Planning in progrees, target completion November 30th Information Technology 2-110-110-5876 IT 57,932.27 45,794.07 45,794.07 Subtotal 84,375.70 46,928.86 46,928.86 PROTECTION TO PERSON Fire Departments Arkona 2-210-211-5875 Radios 899.08 38.58 38.58 2-210-211-5875 Pagers 740.42 906.92 906.92 2-210-211-5875 Bunker Gear 6,134.88 263.28 263.28 Grand Bend 2-210-214-5875 Radios 899.08 38.58 38.58 2-210-214-5875 Pagers 740.42 1,745.51 1,745.51 Northville 2-210-212-5875 Radios 899.08 1,045.75 1,045.75 2-210-212-5875 Pagers 740.42 547.70 547.70 2-210-212-5875 Bunker Gear 3,067.44 2,862.09 2,862.09 Forest 2-210-213-5140 Forest Hall - Floor Drain 11,106.24 476.60 476.60 2-210-213-5875 Air Packs (3) 15,866.06 13,771.42 13,771.42 2-210-213-5875 Pagers 1,480.83 1,773.52 1,773.52 2-210-213-5879 Antenna (Jepp) 16,100.00 16,127.90 16,127.90 <strong>The</strong>dford 2-210-215-5875 Pagers 740.42 1,202.36 1,202.36 2-210-215-5875 Radios 899.08 699.71 699.71 2-210-215-5875 Bunker Gear 6,134.88 8,535.69 8,535.69 General Fire 2-210-210-5876 Breathing Gear 4,759.82 728.58 728.58 2-210-210-5875 Portable Emergency Lighting (Jepp) 10,000.00 0.00 Subtotal 81,208.11 50,764.19 50,764.19 TRANSPORTATION SERVICES Transportation Depot & Land Forest Works Depot - 12 Ann St 2-300-110-5879 New Facility 1,062,316.56 59,702.20 82,868.11 Northville - 9575 Port Franks Rd 2-300-110-5878 Coverall 265,579.14 21,598.26 39,086.80 BM Ross hired to complete operations review. Final report due February 2013 Asphalt base complete Completion expected December 1, 2012. Road Re-Construction 2-300-300-5103 GB - Morenze Lane/Dietrich Cres/Eilber 21,246.33 980.35 980.35 Awarded to BM Ross 2-300-300-5102 GB - Municipal Drive 19,121.70 17,442.87 17,442.87 Completed 2-300-300-5106 GB - Erosion Control - Gill Rd 212,463.31 9,803.49 9,803.49 Work will not be completed in 2012 Funds to be transferred to fund the converall. 2-300-300-5107 BOS - Port Franks Rd 7,436.22 343.12 343.12 In Progress 2-300-300-5112 BOS - Jericho Rd (townsend to cedarpoint) 106,231.66 65,976.76 72,195.64 Dolomite application completed Ditching contract awarded to McCann Redi-Mix. 2-300-300-5113 TH - Pearl St 33,994.13 1,568.58 1,568.58 Awarded to Spriet 2-300-300-5108 TH- Pherrill St W <strong>of</strong> Dumfries to King 6,373.90 294.11 294.11 Awarded to Spriet 2-300-300-5150 ARK - Water ST 16,997.06 16,013.26 16,013.26 Completed 2-300-300-5153 FO - Victoria 57,365.09 2,646.96 2,646.96 RFP distributed to pr<strong>of</strong>essional firms 2-300-300-5110 FO - King St west - shave and pave, rail road way 43,023.82 41,252.73 41,252.73 Completed - pending invoice Work complete with first lift <strong>of</strong> asphalt. Second lift in 2013 2-300-300-5151 FO - Morris - Main to Macdonald 300,848.05 32,615.20 32,615.20 2-300-300-5152 FO - Water St 47,804.25 27,132.56 27,132.56 Completed - pending invoice 2-300-300-5154 FO - old arena entrance - shave and pave 19,121.70 16,002.16 16,002.16 Completed Re-Surface Treatment 2-300-300-5111 GB - Lakeview Ave - Ontario to Pines Pkwy 26,557.91 44,936.21 44,936.21 2-300-300-5155 GB - William St - Pines Pkwy to Shoreline Dr 5,311.58 245.10 245.10 2-300-300-5172 BOS - Gordon Rd 101,982.39 80,336.98 80,336.98 2-300-300-5157 BOS - Lakeview Haven Drive - Lakeshore road to end (1200m) 79,673.74 47,327.28 47,327.28 2-300-300-5158 BOS - Vance Drive - full subdivision 75,424.48 65,977.49 65,977.49 2-300-300-5164 BOS - Glendale Drive - full subdivision 74,362.16 49,801.53 49,801.53 2-300-300-5165 BOS - Cedar Point Line -full subdivision 92,421.54 64,687.46 64,687.46 2-300-300-5168 BOS - Clemens Line - Army Camp to South end 4,249.27 196.08 196.08 2-300-300-5169 BOS - Klondyke Rd 127,077.89 127,077.89 2-300-300-5170 ARK - Arkona Rd - from Cty Rd 79 to Bog Line 10,623.17 490.17 490.17 Work completed - pending invoice Contractor to return and recoat "liquid road" on lakeview ave due to unsatisfactory result in Sept 2012 96 page 1 <strong>of</strong> 4 11/16/2012


