ecological characterization atlas of coastal alabama - Data Center
ecological characterization atlas of coastal alabama - Data Center
ecological characterization atlas of coastal alabama - Data Center

You also want an ePaper? Increase the reach of your titles
YUMPU automatically turns print PDFs into web optimized ePapers that Google loves.
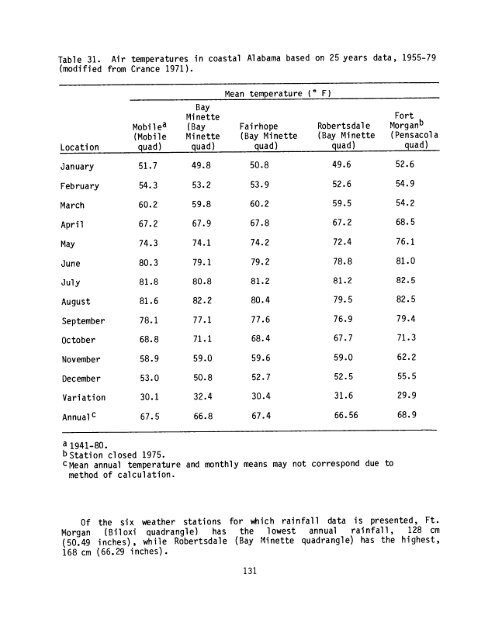
Table 31 . Air temperatures in <strong>coastal</strong> Alabama based on 25 years data, 1955-79<br />
(modified from Crance 1971) .<br />
Mean temperature (° F)<br />
Bay<br />
Minette<br />
Fort<br />
Mobilea (Bay Fairhope Robertsdale Morganb<br />
(Mobile Minette (Bay Minette (Bay Minette (Pensacola<br />
Location quad) quad) quad) quad) quad)<br />
January 51 .7 49 .8 50 .8 49 .6 52 .6<br />
February 54 .3 53 .2 53 .9 52 .6 54 .9<br />
March 60 .2 59 .8 60 .2 59 .5 54 .2<br />
April 67 .2 67 .9 67 .8 67 .2 68 .5<br />
May 74 .3 74 .1 74 .2 72 .4 76 .1<br />
June 80 .3 79 .1 79 .2 78 .8 81 .0<br />
July 81 .8 80 .8 81 .2 81 .2 82 .5<br />
August 81 .6 82 .2 80 .4 79 .5 82 .5<br />
September 78 .1 77 .1 77 .6 76 .9 79 .4<br />
October 68.8 71 .1 68.4 67 .7 71 .3<br />
November 58 .9 59 .0 59 .6 59 .0 62 .2<br />
December 53 .0 50 .8 52 .7 52 .5 55 .5<br />
Variation 30 .1 32 .4 30 .4 31 .6 29 .9<br />
Annualc 67 .5 66 .8 67 .4 66 .56 68 .9<br />
a 1941-80 .<br />
b Station closed 1975 .<br />
c Mean annual temperature and monthly means may not correspond due to<br />
method <strong>of</strong> calculation .<br />
Of the six weather stations for which rainfall data is presented, Ft .<br />
Morgan (Biloxi quadrangle) has the lowest annual rainfall, 128 cm<br />
(50.49 inches), while Robertsdale (Bay Minette quadrangle) has the highest,<br />
168 cm (66 .29 inches) .<br />
131