Annual Report 2010-11 - PACT Charter School
Annual Report 2010-11 - PACT Charter School
Annual Report 2010-11 - PACT Charter School

Create successful ePaper yourself
Turn your PDF publications into a flip-book with our unique Google optimized e-Paper software.
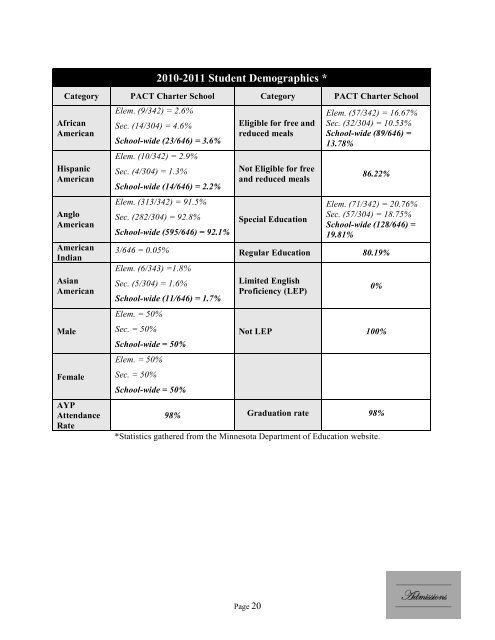
<strong>2010</strong>-20<strong>11</strong> Student Demographics *<br />
Category <strong>PACT</strong> <strong>Charter</strong> <strong>School</strong> Category <strong>PACT</strong> <strong>Charter</strong> <strong>School</strong><br />
African<br />
American<br />
Hispanic<br />
American<br />
Anglo<br />
American<br />
American<br />
Indian<br />
Asian<br />
American<br />
Male<br />
Female<br />
AYP<br />
Attendance<br />
Rate<br />
Elem. (9/342) = 2.6%<br />
Sec. (14/304) = 4.6%<br />
<strong>School</strong>-wide (23/646) = 3.6%<br />
Elem. (10/342) = 2.9%<br />
Sec. (4/304) = 1.3%<br />
<strong>School</strong>-wide (14/646) = 2.2%<br />
Elem. (313/342) = 91.5%<br />
Sec. (282/304) = 92.8%<br />
<strong>School</strong>-wide (595/646) = 92.1%<br />
Eligible for free and<br />
reduced meals<br />
Not Eligible for free<br />
and reduced meals<br />
Special Education<br />
Elem. (57/342) = 16.67%<br />
Sec. (32/304) = 10.53%<br />
<strong>School</strong>-wide (89/646) =<br />
13.78%<br />
86.22%<br />
Elem. (71/342) = 20.76%<br />
Sec. (57/304) = 18.75%<br />
<strong>School</strong>-wide (128/646) =<br />
19.81%<br />
3/646 = 0.05% Regular Education 80.19%<br />
Elem. (6/343) =1.8%<br />
Sec. (5/304) = 1.6%<br />
<strong>School</strong>-wide (<strong>11</strong>/646) = 1.7%<br />
Elem. = 50%<br />
Sec. = 50%<br />
<strong>School</strong>-wide = 50%<br />
Elem. = 50%<br />
Sec. = 50%<br />
<strong>School</strong>-wide = 50%<br />
Limited English<br />
Proficiency (LEP)<br />
0%<br />
Not LEP 100%<br />
98% Graduation rate 98%<br />
*Statistics gathered from the Minnesota Department of Education website.<br />
Page 20