Annual Report 2010-11 - PACT Charter School
Annual Report 2010-11 - PACT Charter School
Annual Report 2010-11 - PACT Charter School

Create successful ePaper yourself
Turn your PDF publications into a flip-book with our unique Google optimized e-Paper software.
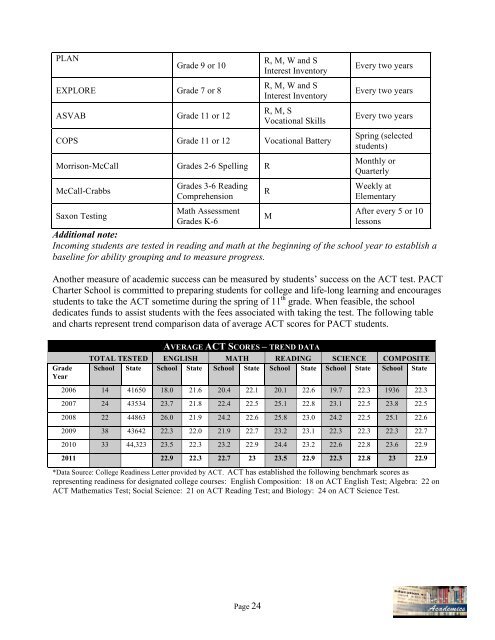
PLAN<br />
Grade 9 or 10<br />
EXPLORE Grade 7 or 8<br />
ASVAB Grade <strong>11</strong> or 12<br />
R, M, W and S<br />
Interest Inventory<br />
R, M, W and S<br />
Interest Inventory<br />
R, M, S<br />
Vocational Skills<br />
COPS Grade <strong>11</strong> or 12 Vocational Battery<br />
Morrison-McCall Grades 2-6 Spelling R<br />
McCall-Crabbs<br />
Saxon Testing<br />
Grades 3-6 Reading<br />
Comprehension<br />
Math Assessment<br />
Grades K-6<br />
R<br />
M<br />
Every two years<br />
Every two years<br />
Every two years<br />
Spring (selected<br />
students)<br />
Monthly or<br />
Quarterly<br />
Weekly at<br />
Elementary<br />
After every 5 or 10<br />
lessons<br />
Additional note:<br />
Incoming students are tested in reading and math at the beginning of the school year to establish a<br />
baseline for ability grouping and to measure progress.<br />
Another measure of academic success can be measured by students’ success on the ACT test. <strong>PACT</strong><br />
<strong>Charter</strong> <strong>School</strong> is committed to preparing students for college and life-long learning and encourages<br />
students to take the ACT sometime during the spring of <strong>11</strong> th grade. When feasible, the school<br />
dedicates funds to assist students with the fees associated with taking the test. The following table<br />
and charts represent trend comparison data of average ACT scores for <strong>PACT</strong> students.<br />
Grade<br />
Year<br />
AVERAGE ACT SCORES – TREND DATA<br />
TOTAL TESTED ENGLISH MATH READING SCIENCE COMPOSITE<br />
<strong>School</strong> State <strong>School</strong> State <strong>School</strong> State <strong>School</strong> State <strong>School</strong> State <strong>School</strong> State<br />
2006 14 41650 18.0 21.6 20.4 22.1 20.1 22.6 19.7 22.3 1936 22.3<br />
2007 24 43534 23.7 21.8 22.4 22.5 25.1 22.8 23.1 22.5 23.8 22.5<br />
2008 22 44863 26.0 21.9 24.2 22.6 25.8 23.0 24.2 22.5 25.1 22.6<br />
2009 38 43642 22.3 22.0 21.9 22.7 23.2 23.1 22.3 22.3 22.3 22.7<br />
<strong>2010</strong> 33 44,323 23.5 22.3 23.2 22.9 24.4 23.2 22.6 22.8 23.6 22.9<br />
20<strong>11</strong> 22.9 22.3 22.7 23 23.5 22.9 22.3 22.8 23 22.9<br />
*Data Source: College Readiness Letter provided by ACT. ACT has established the following benchmark scores as<br />
representing readiness for designated college courses: English Composition: 18 on ACT English Test; Algebra: 22 on<br />
ACT Mathematics Test; Social Science: 21 on ACT Reading Test; and Biology: 24 on ACT Science Test.<br />
Page 24