Nuclear Spectroscopy
Nuclear Spectroscopy
Nuclear Spectroscopy
You also want an ePaper? Increase the reach of your titles
YUMPU automatically turns print PDFs into web optimized ePapers that Google loves.
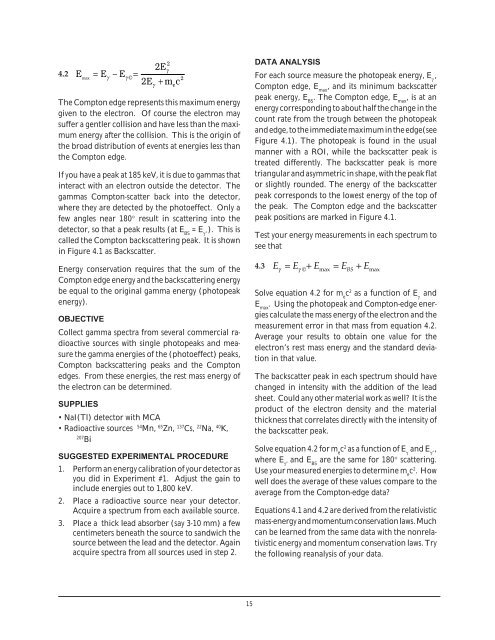
4.2<br />
2<br />
2Eγ<br />
E = E E<br />
max γ<br />
−<br />
γ ©<br />
=<br />
2E<br />
+ m e<br />
c<br />
The Compton edge represents this maximum energy<br />
given to the electron. Of course the electron may<br />
suffer a gentler collision and have less than the maximum<br />
energy after the collision. This is the origin of<br />
the broad distribution of events at energies less than<br />
the Compton edge.<br />
If you have a peak at 185 keV, it is due to gammas that<br />
interact with an electron outside the detector. The<br />
gammas Compton-scatter back into the detector,<br />
where they are detected by the photoeffect. Only a<br />
few angles near 180° result in scattering into the<br />
detector, so that a peak results (at E BS<br />
= E γ ’<br />
). This is<br />
called the Compton backscattering peak. It is shown<br />
in Figure 4.1 as Backscatter.<br />
Energy conservation requires that the sum of the<br />
Compton edge energy and the backscattering energy<br />
be equal to the original gamma energy (photopeak<br />
energy).<br />
OBJECTIVE<br />
Collect gamma spectra from several commercial radioactive<br />
sources with single photopeaks and measure<br />
the gamma energies of the (photoeffect) peaks,<br />
Compton backscattering peaks and the Compton<br />
edges. From these energies, the rest mass energy of<br />
the electron can be determined.<br />
SUPPLIES<br />
• NaI(Tl) detector with MCA<br />
• Radioactive sources 54 Mn, 65 Zn, 137 Cs, 22 Na, 40 K,<br />
207<br />
Bi<br />
SUGGESTED EXPERIMENTAL PROCEDURE<br />
1. Perform an energy calibration of your detector as<br />
you did in Experiment #1. Adjust the gain to<br />
include energies out to 1,800 keV.<br />
2. Place a radioactive source near your detector.<br />
Acquire a spectrum from each available source.<br />
3. Place a thick lead absorber (say 3-10 mm) a few<br />
centimeters beneath the source to sandwich the<br />
source between the lead and the detector. Again<br />
acquire spectra from all sources used in step 2.<br />
γ<br />
2<br />
DATA ANALYSIS<br />
For each source measure the photopeak energy, E γ<br />
,<br />
Compton edge, E max<br />
, and its minimum backscatter<br />
peak energy, E BS<br />
. The Compton edge, E max<br />
, is at an<br />
energy corresponding to about half the change in the<br />
count rate from the trough between the photopeak<br />
and edge, to the immediate maximum in the edge(see<br />
Figure 4.1). The photopeak is found in the usual<br />
manner with a ROI, while the backscatter peak is<br />
treated differently. The backscatter peak is more<br />
triangular and asymmetric in shape, with the peak flat<br />
or slightly rounded. The energy of the backscatter<br />
peak corresponds to the lowest energy of the top of<br />
the peak. The Compton edge and the backscatter<br />
peak positions are marked in Figure 4.1.<br />
Test your energy measurements in each spectrum to<br />
see that<br />
4.3<br />
E = E + E = E + E<br />
γ<br />
γ © max BS max<br />
Solve equation 4.2 for m e<br />
c 2 as a function of E γ<br />
and<br />
E max<br />
. Using the photopeak and Compton-edge energies<br />
calculate the mass energy of the electron and the<br />
measurement error in that mass from equation 4.2.<br />
Average your results to obtain one value for the<br />
electron’s rest mass energy and the standard deviation<br />
in that value.<br />
The backscatter peak in each spectrum should have<br />
changed in intensity with the addition of the lead<br />
sheet. Could any other material work as well? It is the<br />
product of the electron density and the material<br />
thickness that correlates directly with the intensity of<br />
the backscatter peak.<br />
Solve equation 4.2 for m e<br />
c 2 as a function of E γ<br />
and E γ ’<br />
,<br />
where E γ ’<br />
and E BS<br />
are the same for 180° scattering.<br />
Use your measured energies to determine m e<br />
c 2 . How<br />
well does the average of these values compare to the<br />
average from the Compton-edge data?<br />
Equations 4.1 and 4.2 are derived from the relativistic<br />
mass-energy and momentum conservation laws. Much<br />
can be learned from the same data with the nonrelativistic<br />
energy and momentum conservation laws. Try<br />
the following reanalysis of your data.<br />
15


