Nuclear Spectroscopy
Nuclear Spectroscopy
Nuclear Spectroscopy

Create successful ePaper yourself
Turn your PDF publications into a flip-book with our unique Google optimized e-Paper software.
1<br />
0.8<br />
which is coincident with the gamma from the 226 Ra<br />
decay. An enriched source will have a much larger<br />
peak at 185 keV than you have observed for the natural<br />
uranium ores.<br />
Activity<br />
0.6<br />
0.4<br />
Pb-214<br />
Bi-214<br />
Exercise 13.2<br />
Gamma Spectra from Materials<br />
Containing Radium and Radon<br />
0.2<br />
ratio<br />
(Bi/Pb)<br />
0<br />
0 50 100 150 200 250 300<br />
Time (min)<br />
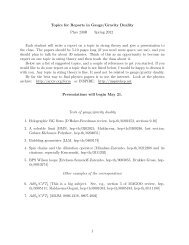
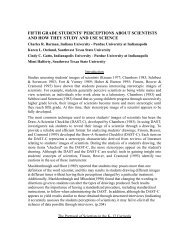
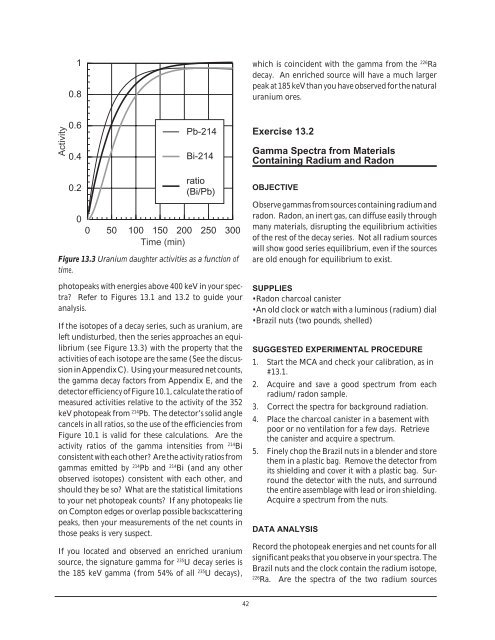
Figure 13.3 Uranium daughter activities as a function of<br />
time.<br />
photopeaks with energies above 400 keV in your spectra?<br />
Refer to Figures 13.1 and 13.2 to guide your<br />
analysis.<br />
If the isotopes of a decay series, such as uranium, are<br />
left undisturbed, then the series approaches an equilibrium<br />
(see Figure 13.3) with the property that the<br />
activities of each isotope are the same (See the discussion<br />
in Appendix C). Using your measured net counts,<br />
the gamma decay factors from Appendix E, and the<br />
detector efficiency of Figure 10.1, calculate the ratio of<br />
measured activities relative to the activity of the 352<br />
keV photopeak from 214 Pb. The detector’s solid angle<br />
cancels in all ratios, so the use of the efficiencies from<br />
Figure 10.1 is valid for these calculations. Are the<br />
activity ratios of the gamma intensities from 214 Bi<br />
consistent with each other? Are the activity ratios from<br />
gammas emitted by 214 Pb and 214 Bi (and any other<br />
observed isotopes) consistent with each other, and<br />
should they be so? What are the statistical limitations<br />
to your net photopeak counts? If any photopeaks lie<br />
on Compton edges or overlap possible backscattering<br />
peaks, then your measurements of the net counts in<br />
those peaks is very suspect.<br />
If you located and observed an enriched uranium<br />
source, the signature gamma for 235 U decay series is<br />
the 185 keV gamma (from 54% of all 235 U decays),<br />
OBJECTIVE<br />
Observe gammas from sources containing radium and<br />
radon. Radon, an inert gas, can diffuse easily through<br />
many materials, disrupting the equilibrium activities<br />
of the rest of the decay series. Not all radium sources<br />
will show good series equilibrium, even if the sources<br />
are old enough for equilibrium to exist.<br />
SUPPLIES<br />
•Radon charcoal canister<br />
•An old clock or watch with a luminous (radium) dial<br />
•Brazil nuts (two pounds, shelled)<br />
SUGGESTED EXPERIMENTAL PROCEDURE<br />
1. Start the MCA and check your calibration, as in<br />
#13.1.<br />
2. Acquire and save a good spectrum from each<br />
radium/radon sample.<br />
3. Correct the spectra for background radiation.<br />
4. Place the charcoal canister in a basement with<br />
poor or no ventilation for a few days. Retrieve<br />
the canister and acquire a spectrum.<br />
5. Finely chop the Brazil nuts in a blender and store<br />
them in a plastic bag. Remove the detector from<br />
its shielding and cover it with a plastic bag. Surround<br />
the detector with the nuts, and surround<br />
the entire assemblage with lead or iron shielding.<br />
Acquire a spectrum from the nuts.<br />
DATA ANALYSIS<br />
Record the photopeak energies and net counts for all<br />
significant peaks that you observe in your spectra. The<br />
Brazil nuts and the clock contain the radium isotope,<br />
226<br />
Ra. Are the spectra of the two radium sources<br />
42