Nuclear Spectroscopy
Nuclear Spectroscopy
Nuclear Spectroscopy

Create successful ePaper yourself
Turn your PDF publications into a flip-book with our unique Google optimized e-Paper software.
Exercise 11.1<br />
Half-Life of 40 K<br />
OBJECTIVE<br />
Measure the activity of a sample of either potassium<br />
chloride (KCl) or anhydrous potassium fluoride (KF)<br />
to estimate the half-life of 40 K. This is more a good<br />
estimate than a precise determination, because the<br />
geometry of the source violates the assumption of a<br />
point source.<br />
SUPPLIES<br />
•Standard 50 ml beaker<br />
•Radioactive sources: 22 Na, 137 Cs<br />
•Chemicals: 40 ml of KF (100 g)and 40 ml of KCl<br />
(80 g)<br />
SUGGESTED EXPERIMENTAL PROCEDURE<br />
1. Have the detector and the MCA operating in the<br />
usual manner.<br />
2. Check the energy scale using the 22 Na source to<br />
be certain that peaks out to 1,600 keV can be<br />
observed.<br />
3. Measure the mass of a 50 ml beaker.<br />
4. Fill the 50 ml beaker with a potassium compound<br />
compressed to the 40 ml level and remeasure the<br />
mass. Place it on the holder in the sixth source<br />
position. Your source material will be approximately<br />
in the fourth position.<br />
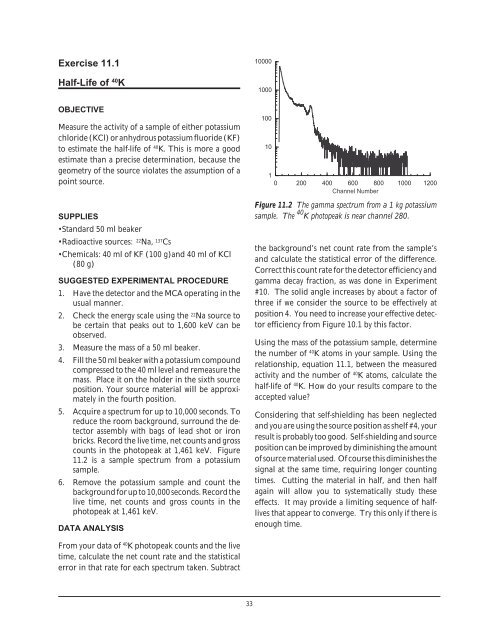
5. Acquire a spectrum for up to 10,000 seconds. To<br />
reduce the room background, surround the detector<br />
assembly with bags of lead shot or iron<br />
bricks. Record the live time, net counts and gross<br />
counts in the photopeak at 1,461 keV. Figure<br />
11.2 is a sample spectrum from a potassium<br />
sample.<br />
6. Remove the potassium sample and count the<br />
background for up to 10,000 seconds. Record the<br />
live time, net counts and gross counts in the<br />
photopeak at 1,461 keV.<br />
DATA ANALYSIS<br />
10000<br />
1000<br />
100<br />
10<br />
1<br />
0 200 400 600 800 1000 1200<br />
Channel Number<br />
Figure 11.2 The gamma spectrum from a 1 kg potassium<br />
sample. The 40 K photopeak is near channel 280.<br />
the background’s net count rate from the sample’s<br />
and calculate the statistical error of the difference.<br />
Correct this count rate for the detector efficiency and<br />
gamma decay fraction, as was done in Experiment<br />
#10. The solid angle increases by about a factor of<br />
three if we consider the source to be effectively at<br />
position 4. You need to increase your effective detector<br />
efficiency from Figure 10.1 by this factor.<br />
Using the mass of the potassium sample, determine<br />
the number of 40 K atoms in your sample. Using the<br />
relationship, equation 11.1, between the measured<br />
activity and the number of 40 K atoms, calculate the<br />
half-life of 40 K. How do your results compare to the<br />
accepted value?<br />
Considering that self-shielding has been neglected<br />
and you are using the source position as shelf #4, your<br />
result is probably too good. Self-shielding and source<br />
position can be improved by diminishing the amount<br />
of source material used. Of course this diminishes the<br />
signal at the same time, requiring longer counting<br />
times. Cutting the material in half, and then half<br />
again will allow you to systematically study these<br />
effects. It may provide a limiting sequence of halflives<br />
that appear to converge. Try this only if there is<br />
enough time.<br />
From your data of 40 K photopeak counts and the live<br />
time, calculate the net count rate and the statistical<br />
error in that rate for each spectrum taken. Subtract<br />
33