Nuclear Spectroscopy
Nuclear Spectroscopy
Nuclear Spectroscopy

Create successful ePaper yourself
Turn your PDF publications into a flip-book with our unique Google optimized e-Paper software.
A P P E N D I X C<br />
Mathematics of Radioactive Decay<br />
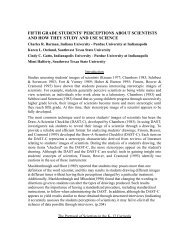
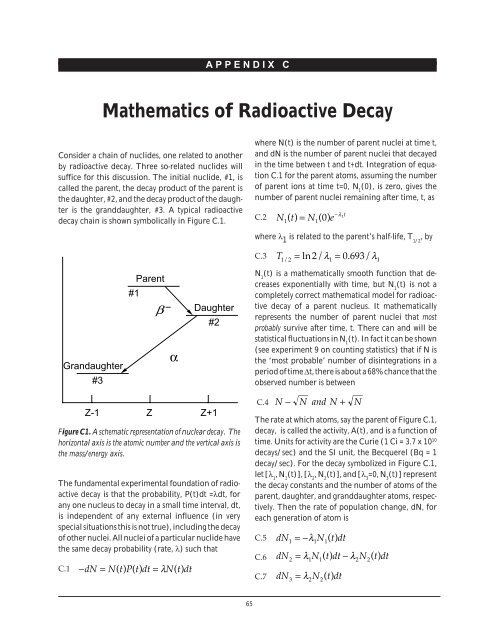
Consider a chain of nuclides, one related to another<br />
by radioactive decay. Three so-related nuclides will<br />
suffice for this discussion. The initial nuclide, #1, is<br />
called the parent, the decay product of the parent is<br />
the daughter, #2, and the decay product of the daughter<br />
is the granddaughter, #3. A typical radioactive<br />
decay chain is shown symbolically in Figure C.1.<br />
where N(t) is the number of parent nuclei at time t,<br />
and dN is the number of parent nuclei that decayed<br />
in the time between t and t+dt. Integration of equation<br />
C.1 for the parent atoms, assuming the number<br />
of parent ions at time t=0, N 1<br />
(0), is zero, gives the<br />
number of parent nuclei remaining after time, t, as<br />
C.2<br />
N () t = N ( ) e<br />
−λ1t<br />
1 1<br />
0<br />
where λ 1 is related to the parent’s half-life, T 1/2<br />
, by<br />
C.3<br />
T 1 2<br />
= 2 λ 1<br />
= 0 693 λ 1<br />
/<br />
ln / . /<br />
Grandaughter<br />
#3<br />
Parent<br />
#1<br />
β<br />
–<br />
α<br />
Daughter<br />
#2<br />
N 1<br />
(t) is a mathematically smooth function that decreases<br />
exponentially with time, but N 1<br />
(t) is not a<br />
completely correct mathematical model for radioactive<br />
decay of a parent nucleus. It mathematically<br />
represents the number of parent nuclei that most<br />
probably survive after time, t. There can and will be<br />
statistical fluctuations in N 1<br />
(t). In fact it can be shown<br />
(see experiment 9 on counting statistics) that if N is<br />
the ‘most probable’ number of disintegrations in a<br />
period of time ∆t, there is about a 68% chance that the<br />
observed number is between<br />
Figure C1. A schematic representation of nuclear decay. The<br />
horizontal axis is the atomic number and the vertical axis is<br />
the mass/energy axis.<br />
The fundamental experimental foundation of radioactive<br />
decay is that the probability, P(t)dt =λdt, for<br />
any one nucleus to decay in a small time interval, dt,<br />
is independent of any external influence (in very<br />
special situations this is not true), including the decay<br />
of other nuclei. All nuclei of a particular nuclide have<br />
the same decay probability (rate, λ) such that<br />
C.1<br />
Z-1 Z Z+1<br />
− dN = N() t P() t dt = λN()<br />
t dt<br />
C.4<br />
N − N and N + N<br />
The rate at which atoms, say the parent of Figure C.1,<br />
decay, is called the activity, A(t), and is a function of<br />
time. Units for activity are the Curie (1 Ci = 3.7 x 10 10<br />
decays/sec) and the SI unit, the Becquerel (Bq = 1<br />
decay/sec). For the decay symbolized in Figure C.1,<br />
let [λ 1<br />
, N 1<br />
(t)], [λ 2<br />
, N 2<br />
(t)], and [λ 3<br />
=0, N 3<br />
(t)] represent<br />
the decay constants and the number of atoms of the<br />
parent, daughter, and granddaughter atoms, respectively.<br />
Then the rate of population change, dN, for<br />
each generation of atom is<br />
C.5<br />
C.6<br />
C.7<br />
dN<br />
=−λ N () t dt<br />
1 1 1<br />
dN = λ N () t dt −λ<br />
N () t dt<br />
2 1 1 2 2<br />
dN3 = λ<br />
2N2()<br />
t dt<br />
65