goodrich petroleum corporation - RR DONNELLEY FINANCIAL
goodrich petroleum corporation - RR DONNELLEY FINANCIAL
goodrich petroleum corporation - RR DONNELLEY FINANCIAL

You also want an ePaper? Increase the reach of your titles
YUMPU automatically turns print PDFs into web optimized ePapers that Google loves.
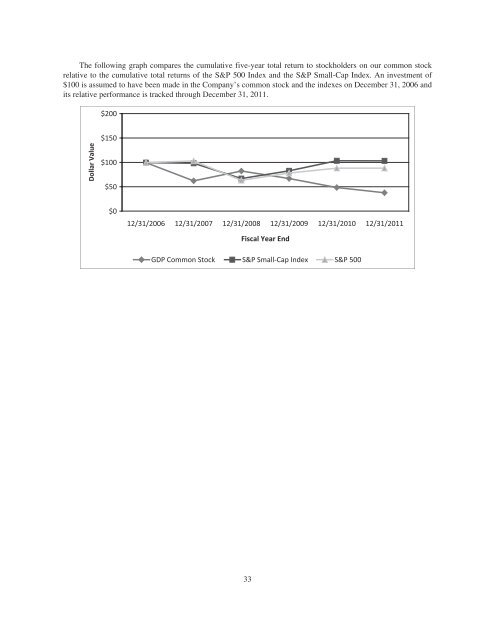
The following graph compares the cumulative five-year total return to stockholders on our common stock<br />
relative to the cumulative total returns of the S&P 500 Index and the S&P Small-Cap Index. An investment of<br />
$100 is assumed to have been made in the Company’s common stock and the indexes on December 31, 2006 and<br />
its relative performance is tracked through December 31, 2011.<br />
$200<br />
Dollar Value<br />
$150<br />
$100<br />
$50<br />
$0<br />
12/31/2006 12/31/2007 12/31/2008 12/31/2009 12/31/2010 12/31/2011<br />
Fiscal Year End<br />
GDP Common Stock S&P Small-Cap Index S&P 500<br />
33