goodrich petroleum corporation - RR DONNELLEY FINANCIAL
goodrich petroleum corporation - RR DONNELLEY FINANCIAL
goodrich petroleum corporation - RR DONNELLEY FINANCIAL

You also want an ePaper? Increase the reach of your titles
YUMPU automatically turns print PDFs into web optimized ePapers that Google loves.
Year ended December 31, 2010 Compared to Year Ended December 31, 2009<br />
Operating activities. Net cash provided by operating activities was $100.4 million, an increase of $15.1<br />
million, or 13%, from $115.6 million in 2009. Our operating revenues increased 34% in 2010 with an 18%<br />
decrease in commodity prices and an increase in average daily production of 13% as compared to 2009. The cash<br />
flow decrease was primarily the result of receiving $24.6 million in natural gas derivative settlements in 2010<br />
compared to having received $98.0 million for settlements of natural gas derivatives in 2009.<br />
Investing activities. Net cash used in investing activities was $200.1 million for the year ended<br />
December 31, 2010, compared to $265.6 million for 2009. While we booked capital expenditures of<br />
approximately $283.7 million in 2010, we paid out cash amounts totaling $265.0 million in 2010, with the<br />
difference being attributed to approximately $30.0 million in drilling and completion costs which were accrued at<br />
December 31, 2010, non-cash asset retirement obligation additions of $1.3 million and geophysical and<br />
geological cost of $1.2 million offset by $13.8 million in drilling and completion cost accrued at December 31,<br />
2009 and paid in 2010. In the fourth quarter of 2010, we incurred additional drilling and completion capital<br />
expenditures in excess of that which was budgeted from (1) acceleration of completion of Haynesville Shale<br />
wells that were scheduled for 2011; (2) incremental drilling and completion costs associated with longer laterals<br />
in our Eagle Ford Shale Trend; and (3) reduced drilling cycles thereby incurring additional drilling capital<br />
expenditures as a result of drilling more wells. Net cash used in investing activities was offset by the receipt of<br />
$64.9 million of cash proceeds from the sale of fixed assets in 2010.<br />
We conducted drilling and completion operations on 46 gross wells in 2010 compared to 45 gross wells in<br />
2009. Of the $265.0 million cash spent in 2010, approximately $227.6 million was for drilling and completion<br />
activities (of which $13.8 million related to 2009 wells), $33.7 million was for leasehold acquisition, $0.6 million<br />
for facilities and infrastructure, $2.3 million for capital workovers, and $0.8 million for furniture, fixtures and<br />
equipment. Of the $265.8 million spent in 2009, approximately $239.5 million was for drilling and completion<br />
activities (of which $28.3 million related to 2008 wells), $15.9 million was for leasehold acquisition, $4.1 million<br />
for facilities and infrastructure, $3.4 million for capital workovers, $1.9 million on geological and geophysical<br />
and $1.0 million for furniture, fixtures and equipment.<br />
Financing activities. Net cash used in financing activities was $7.7 million for 2010, a decrease of $135.3<br />
million from net cash provided by financing activities of $127.6 million in 2009. In September 2009, we received<br />
$218.5 million from the offering of our 5% convertible senior notes due 2029. With the proceeds from the<br />
offering, we paid $8.8 million in offering cost, paid off our $75.0 million second lien term loan and paid off the<br />
$5.0 million balance on our senior credit facility. We had zero borrowings outstanding under our Senior Credit<br />
Facility as of December 31, 2010.<br />
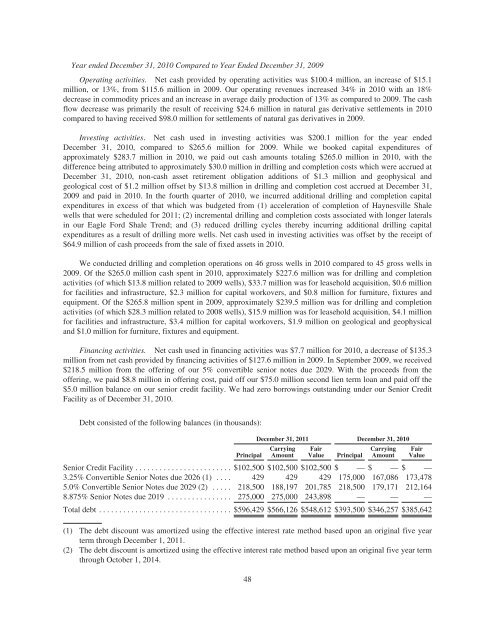
Debt consisted of the following balances (in thousands):<br />
Principal<br />
December 31, 2011 December 31, 2010<br />
Carrying<br />
Amount<br />
Fair<br />
Value<br />
Principal<br />
Carrying<br />
Amount<br />
Fair<br />
Value<br />
Senior Credit Facility ........................ $102,500 $102,500 $102,500 $ — $ — $ —<br />
3.25% Convertible Senior Notes due 2026 (1) .... 429 429 429 175,000 167,086 173,478<br />
5.0% Convertible Senior Notes due 2029 (2) ..... 218,500 188,197 201,785 218,500 179,171 212,164<br />
8.875% Senior Notes due 2019 ................ 275,000 275,000 243,898 — — —<br />
Total debt ................................. $596,429 $566,126 $548,612 $393,500 $346,257 $385,642<br />
(1) The debt discount was amortized using the effective interest rate method based upon an original five year<br />
term through December 1, 2011.<br />
(2) The debt discount is amortized using the effective interest rate method based upon an original five year term<br />
through October 1, 2014.<br />
48