goodrich petroleum corporation - RR DONNELLEY FINANCIAL
goodrich petroleum corporation - RR DONNELLEY FINANCIAL
goodrich petroleum corporation - RR DONNELLEY FINANCIAL

Create successful ePaper yourself
Turn your PDF publications into a flip-book with our unique Google optimized e-Paper software.
GOODRICH PETROLEUM CORPORATION AND SUBSIDIARY<br />
SUPPLEMENTAL INFORMATION<br />
(Unaudited)<br />
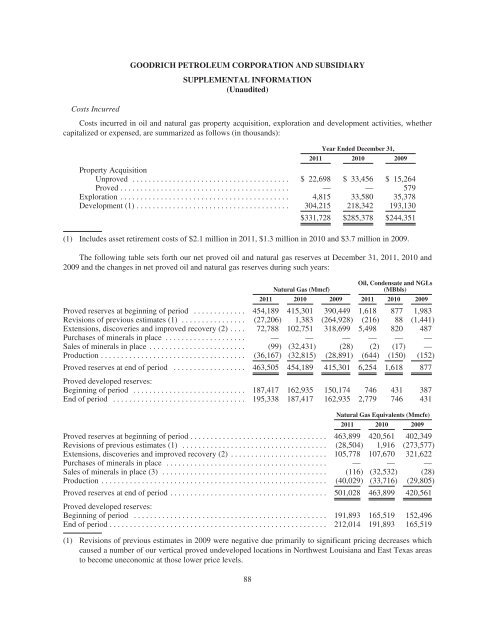
Costs Incurred<br />
Costs incurred in oil and natural gas property acquisition, exploration and development activities, whether<br />
capitalized or expensed, are summarized as follows (in thousands):<br />
Year Ended December 31,<br />
2011 2010 2009<br />
Property Acquisition<br />
Unproved ....................................... $ 22,698 $ 33,456 $ 15,264<br />
Proved .......................................... — — 579<br />
Exploration .......................................... 4,815 33,580 35,378<br />
Development (1) ...................................... 304,215 218,342 193,130<br />
$331,728 $285,378 $244,351<br />
(1) Includes asset retirement costs of $2.1 million in 2011, $1.3 million in 2010 and $3.7 million in 2009.<br />
The following table sets forth our net proved oil and natural gas reserves at December 31, 2011, 2010 and<br />
2009 and the changes in net proved oil and natural gas reserves during such years:<br />
Oil, Condensate and NGLs<br />
Natural Gas (Mmcf)<br />
(MBbls)<br />
2011 2010 2009 2011 2010 2009<br />
Proved reserves at beginning of period ............. 454,189 415,301 390,449 1,618 877 1,983<br />
Revisions of previous estimates (1) ................ (27,206) 1,383 (264,928) (216) 88 (1,441)<br />
Extensions, discoveries and improved recovery (2) .... 72,788 102,751 318,699 5,498 820 487<br />
Purchases of minerals in place .................... — — — — — —<br />
Sales of minerals in place ........................ (99) (32,431) (28) (2) (17) —<br />
Production .................................... (36,167) (32,815) (28,891) (644) (150) (152)<br />
Proved reserves at end of period .................. 463,505 454,189 415,301 6,254 1,618 877<br />
Proved developed reserves:<br />
Beginning of period ............................ 187,417 162,935 150,174 746 431 387<br />
End of period ................................. 195,338 187,417 162,935 2,779 746 431<br />
Natural Gas Equivalents (Mmcfe)<br />
2011 2010 2009<br />
Proved reserves at beginning of period .................................. 463,899 420,561 402,349<br />
Revisions of previous estimates (1) .................................... (28,504) 1,916 (273,577)<br />
Extensions, discoveries and improved recovery (2) ........................ 105,778 107,670 321,622<br />
Purchases of minerals in place ........................................ — — —<br />
Sales of minerals in place (3) ......................................... (116) (32,532) (28)<br />
Production ........................................................ (40,029) (33,716) (29,805)<br />
Proved reserves at end of period ....................................... 501,028 463,899 420,561<br />
Proved developed reserves:<br />
Beginning of period ................................................ 191,893 165,519 152,496<br />
End of period ...................................................... 212,014 191,893 165,519<br />
(1) Revisions of previous estimates in 2009 were negative due primarily to significant pricing decreases which<br />
caused a number of our vertical proved undeveloped locations in Northwest Louisiana and East Texas areas<br />
to become uneconomic at those lower price levels.<br />
88