goodrich petroleum corporation - RR DONNELLEY FINANCIAL
goodrich petroleum corporation - RR DONNELLEY FINANCIAL
goodrich petroleum corporation - RR DONNELLEY FINANCIAL

Create successful ePaper yourself
Turn your PDF publications into a flip-book with our unique Google optimized e-Paper software.
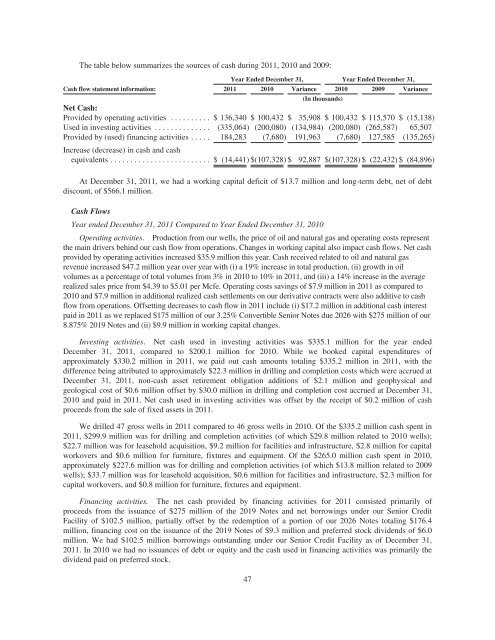
The table below summarizes the sources of cash during 2011, 2010 and 2009:<br />
Year Ended December 31, Year Ended December 31,<br />
Cash flow statement information: 2011 2010 Variance 2010 2009 Variance<br />
(In thousands)<br />
Net Cash:<br />
Provided by operating activities .......... $136,340 $ 100,432 $ 35,908 $ 100,432 $ 115,570 $ (15,138)<br />
Used in investing activities .............. (335,064) (200,080) (134,984) (200,080) (265,587) 65,507<br />
Provided by (used) financing activities ..... 184,283 (7,680) 191,963 (7,680) 127,585 (135,265)<br />
Increase (decrease) in cash and cash<br />
equivalents ......................... $ (14,441) $(107,328) $ 92,887 $(107,328) $ (22,432) $ (84,896)<br />
At December 31, 2011, we had a working capital deficit of $13.7 million and long-term debt, net of debt<br />
discount, of $566.1 million.<br />
Cash Flows<br />
Year ended December 31, 2011 Compared to Year Ended December 31, 2010<br />
Operating activities. Production from our wells, the price of oil and natural gas and operating costs represent<br />
the main drivers behind our cash flow from operations. Changes in working capital also impact cash flows. Net cash<br />
provided by operating activities increased $35.9 million this year. Cash received related to oil and natural gas<br />
revenue increased $47.2 million year over year with (i) a 19% increase in total production, (ii) growth in oil<br />
volumes as a percentage of total volumes from 3% in 2010 to 10% in 2011, and (iii) a 14% increase in the average<br />
realized sales price from $4.39 to $5.01 per Mcfe. Operating costs savings of $7.9 million in 2011 as compared to<br />
2010 and $7.9 million in additional realized cash settlements on our derivative contracts were also additive to cash<br />
flow from operations. Offsetting decreases to cash flow in 2011 include (i) $17.2 million in additional cash interest<br />
paid in 2011 as we replaced $175 million of our 3.25% Convertible Senior Notes due 2026 with $275 million of our<br />
8.875% 2019 Notes and (ii) $9.9 million in working capital changes.<br />
Investing activities. Net cash used in investing activities was $335.1 million for the year ended<br />
December 31, 2011, compared to $200.1 million for 2010. While we booked capital expenditures of<br />
approximately $330.2 million in 2011, we paid out cash amounts totaling $335.2 million in 2011, with the<br />
difference being attributed to approximately $22.3 million in drilling and completion costs which were accrued at<br />
December 31, 2011, non-cash asset retirement obligation additions of $2.1 million and geophysical and<br />
geological cost of $0.6 million offset by $30.0 million in drilling and completion cost accrued at December 31,<br />
2010 and paid in 2011. Net cash used in investing activities was offset by the receipt of $0.2 million of cash<br />
proceeds from the sale of fixed assets in 2011.<br />
We drilled 47 gross wells in 2011 compared to 46 gross wells in 2010. Of the $335.2 million cash spent in<br />
2011, $299.9 million was for drilling and completion activities (of which $29.8 million related to 2010 wells);<br />
$22.7 million was for leasehold acquisition, $9.2 million for facilities and infrastructure, $2.8 million for capital<br />
workovers and $0.6 million for furniture, fixtures and equipment. Of the $265.0 million cash spent in 2010,<br />
approximately $227.6 million was for drilling and completion activities (of which $13.8 million related to 2009<br />
wells); $33.7 million was for leasehold acquisition, $0.6 million for facilities and infrastructure, $2.3 million for<br />
capital workovers, and $0.8 million for furniture, fixtures and equipment.<br />
Financing activities. The net cash provided by financing activities for 2011 consisted primarily of<br />
proceeds from the issuance of $275 million of the 2019 Notes and net borrowings under our Senior Credit<br />
Facility of $102.5 million, partially offset by the redemption of a portion of our 2026 Notes totaling $176.4<br />
million, financing cost on the issuance of the 2019 Notes of $9.3 million and preferred stock dividends of $6.0<br />
million. We had $102.5 million borrowings outstanding under our Senior Credit Facility as of December 31,<br />
2011. In 2010 we had no issuances of debt or equity and the cash used in financing activities was primarily the<br />
dividend paid on preferred stock.<br />
47