goodrich petroleum corporation - RR DONNELLEY FINANCIAL
goodrich petroleum corporation - RR DONNELLEY FINANCIAL
goodrich petroleum corporation - RR DONNELLEY FINANCIAL

You also want an ePaper? Increase the reach of your titles
YUMPU automatically turns print PDFs into web optimized ePapers that Google loves.
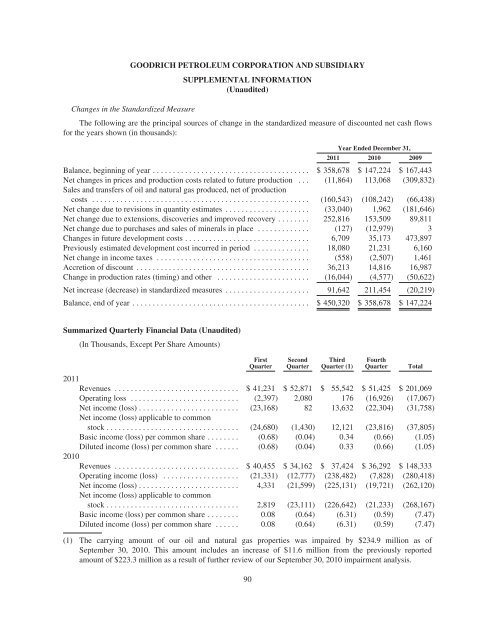
GOODRICH PETROLEUM CORPORATION AND SUBSIDIARY<br />
SUPPLEMENTAL INFORMATION<br />
(Unaudited)<br />
Changes in the Standardized Measure<br />
The following are the principal sources of change in the standardized measure of discounted net cash flows<br />
for the years shown (in thousands):<br />
Year Ended December 31,<br />
2011 2010 2009<br />
Balance, beginning of year ....................................... $358,678 $ 147,224 $ 167,443<br />
Net changes in prices and production costs related to future production . . . (11,864) 113,068 (309,832)<br />
Sales and transfers of oil and natural gas produced, net of production<br />
costs ...................................................... (160,543) (108,242) (66,438)<br />
Net change due to revisions in quantity estimates ..................... (33,040) 1,962 (181,646)<br />
Net change due to extensions, discoveries and improved recovery ........ 252,816 153,509 89,811<br />
Net change due to purchases and sales of minerals in place ............. (127) (12,979) 3<br />
Changes in future development costs ............................... 6,709 35,173 473,897<br />
Previously estimated development cost incurred in period .............. 18,080 21,231 6,160<br />
Net change in income taxes ...................................... (558) (2,507) 1,461<br />
Accretion of discount ........................................... 36,213 14,816 16,987<br />
Change in production rates (timing) and other ....................... (16,044) (4,577) (50,622)<br />
Net increase (decrease) in standardized measures ..................... 91,642 211,454 (20,219)<br />
Balance, end of year ............................................ $450,320 $ 358,678 $ 147,224<br />
Summarized Quarterly Financial Data (Unaudited)<br />
(In Thousands, Except Per Share Amounts)<br />
First<br />
Quarter<br />
Second<br />
Quarter<br />
Third<br />
Quarter (1)<br />
Fourth<br />
Quarter<br />
2011<br />
Revenues ............................... $41,231 $ 52,871 $ 55,542 $ 51,425 $ 201,069<br />
Operating loss ........................... (2,397) 2,080 176 (16,926) (17,067)<br />
Net income (loss) ......................... (23,168) 82 13,632 (22,304) (31,758)<br />
Net income (loss) applicable to common<br />
stock ................................. (24,680) (1,430) 12,121 (23,816) (37,805)<br />
Basic income (loss) per common share ........ (0.68) (0.04) 0.34 (0.66) (1.05)<br />
Diluted income (loss) per common share ...... (0.68) (0.04) 0.33 (0.66) (1.05)<br />
2010<br />
Revenues ............................... $40,455 $ 34,162 $ 37,424 $ 36,292 $ 148,333<br />
Operating income (loss) ................... (21,331) (12,777) (238,482) (7,828) (280,418)<br />
Net income (loss) ......................... 4,331 (21,599) (225,131) (19,721) (262,120)<br />
Net income (loss) applicable to common<br />
stock ................................. 2,819 (23,111) (226,642) (21,233) (268,167)<br />
Basic income (loss) per common share ........ 0.08 (0.64) (6.31) (0.59) (7.47)<br />
Diluted income (loss) per common share ...... 0.08 (0.64) (6.31) (0.59) (7.47)<br />
(1) The carrying amount of our oil and natural gas properties was impaired by $234.9 million as of<br />
September 30, 2010. This amount includes an increase of $11.6 million from the previously reported<br />
amount of $223.3 million as a result of further review of our September 30, 2010 impairment analysis.<br />
90<br />
Total