10-K - SCANA Corporation
10-K - SCANA Corporation
10-K - SCANA Corporation

You also want an ePaper? Increase the reach of your titles
YUMPU automatically turns print PDFs into web optimized ePapers that Google loves.
Table of Contents<br />
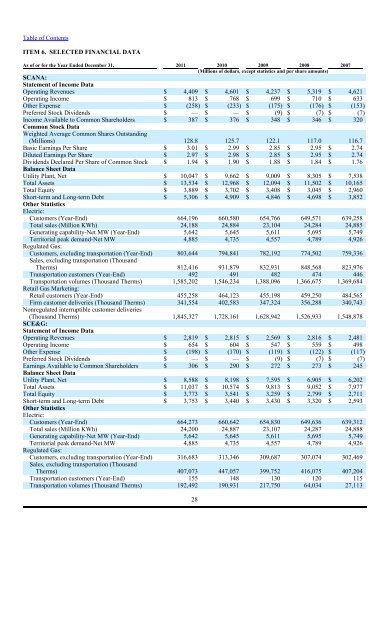
ITEM 6. SELECTED FINANCIAL DATA<br />
As of or for the Year Ended December 31, 2011 20<strong>10</strong> 2009 2008 2007<br />
(Millions of dollars, except statistics and per share amounts)<br />
<strong>SCANA</strong>:<br />
Statement of Income Data<br />
Operating Revenues $ 4,409 $ 4,601 $ 4,237 $ 5,319 $ 4,621<br />
Operating Income $ 813 $ 768 $ 699 $ 7<strong>10</strong> $ 633<br />
Other Expense $ (258) $ (233) $ (175) $ (176) $ (153)<br />
Preferred Stock Dividends $ — $ — $ (9) $ (7) $ (7)<br />
Income Available to Common Shareholders $ 387 $ 376 $ 348 $ 346 $ 320<br />
Common Stock Data<br />
Weighted Average Common Shares Outstanding<br />
(Millions) 128.8 125.7 122.1 117.0 116.7<br />
Basic Earnings Per Share $ 3.01 $ 2.99 $ 2.85 $ 2.95 $ 2.74<br />
Diluted Earnings Per Share $ 2.97 $ 2.98 $ 2.85 $ 2.95 $ 2.74<br />
Dividends Declared Per Share of Common Stock $ 1.94 $ 1.90 $ 1.88 $ 1.84 $ 1.76<br />
Balance Sheet Data<br />
Utility Plant, Net $ <strong>10</strong>,047 $ 9,662 $ 9,009 $ 8,305 $ 7,538<br />
Total Assets $ 13,534 $ 12,968 $ 12,094 $ 11,502 $ <strong>10</strong>,165<br />
Total Equity $ 3,889 $ 3,702 $ 3,408 $ 3,045 $ 2,960<br />
Short-term and Long-term Debt $ 5,306 $ 4,909 $ 4,846 $ 4,698 $ 3,852<br />
Other Statistics<br />
Electric:<br />
Customers (Year-End) 664,196 660,580 654,766 649,571 639,258<br />
Total sales (Million KWh) 24,188 24,884 23,<strong>10</strong>4 24,284 24,885<br />
Generating capability-Net MW (Year-End) 5,642 5,645 5,611 5,695 5,749<br />
Territorial peak demand-Net MW 4,885 4,735 4,557 4,789 4,926<br />
Regulated Gas:<br />
Customers, excluding transportation (Year-End) 803,644 794,841 782,192 774,502 759,336<br />
Sales, excluding transportation (Thousand<br />
Therms) 812,416 931,879 832,931 848,568 823,976<br />
Transportation customers (Year-End) 492 491 482 474 446<br />
Transportation volumes (Thousand Therms) 1,585,202 1,546,234 1,388,096 1,366,675 1,369,684<br />
Retail Gas Marketing:<br />
Retail customers (Year-End) 455,258 464,123 455,198 459,250 484,565<br />
Firm customer deliveries (Thousand Therms) 341,554 402,583 347,324 356,288 340,743<br />
Nonregulated interruptible customer deliveries<br />
(Thousand Therms) 1,845,327 1,728,161 1,628,942 1,526,933 1,548,878<br />
SCE&G:<br />
Statement of Income Data<br />
Operating Revenues $ 2,819 $ 2,815 $ 2,569 $ 2,816 $ 2,481<br />
Operating Income $ 654 $ 604 $ 547 $ 559 $ 498<br />
Other Expense $ (198) $ (170) $ (119) $ (122) $ (117)<br />
Preferred Stock Dividends $ — $ — $ (9) $ (7) $ (7)<br />
Earnings Available to Common Shareholders $ 306 $ 290 $ 272 $ 273 $ 245<br />
Balance Sheet Data<br />
Utility Plant, Net $ 8,588 $ 8,198 $ 7,595 $ 6,905 $ 6,202<br />
Total Assets $ 11,037 $ <strong>10</strong>,574 $ 9,813 $ 9,052 $ 7,977<br />
Total Equity $ 3,773 $ 3,541 $ 3,259 $ 2,799 $ 2,711<br />
Short-term and Long-term Debt $ 3,753 $ 3,440 $ 3,430 $ 3,320 $ 2,593<br />
Other Statistics<br />
Electric:<br />
Customers (Year-End) 664,273 660,642 654,830 649,636 639,312<br />
Total sales (Million KWh) 24,200 24,887 23,<strong>10</strong>7 24,287 24,888<br />
Generating capability-Net MW (Year-End) 5,642 5,645 5,611 5,695 5,749<br />
Territorial peak demand-Net MW 4,885 4,735 4,557 4,789 4,926<br />
Regulated Gas:<br />
Customers, excluding transportation (Year-End) 316,683 313,346 309,687 307,074 302,469<br />
Sales, excluding transportation (Thousand<br />
Therms) 407,073 447,057 399,752 416,075 407,204<br />
Transportation customers (Year-End) 155 148 130 120 115<br />
Transportation volumes (Thousand Therms) 192,492 190,931 217,750 64,034 27,113<br />
28