Multiattribute acceptance sampling plans - Library(ISI Kolkata ...
Multiattribute acceptance sampling plans - Library(ISI Kolkata ...
Multiattribute acceptance sampling plans - Library(ISI Kolkata ...

Create successful ePaper yourself
Turn your PDF publications into a flip-book with our unique Google optimized e-Paper software.
Further,<br />
∫ ∫<br />
... P (p)dw(p 1 )dw(p 2 )...dw(p r ) =<br />
∫p ∑ r∏<br />
x ∈ A g(x i , n ¯p i , s i ).<br />
1 p 2 p r i=1<br />
Using the above we get the result.<br />
3.1.6 Bayesian Plans<br />
Using the expression (3.1.7), we may now construct optimal A kind, C kind and D kind<br />
<strong>plans</strong> for a given lot size N, cost parameters and the parameters of the prior distributions<br />
and compare their relative merit in a given situation. We demonstrate this with one real life<br />
example obtained in respect of plastic containers used for cosmetics.<br />
In this case the defects which can be categorized as major type are defects like colour<br />
variation, improper neck finishing, prominent marks, weak body. The cost of testing this is<br />
approximately around Rs. 0.06 per unit. The minor type of defects are black spot, shrink<br />
marks, less visible parting lines which can be verified at a cost of around Rs 0.14 per unit.<br />
( Note that verification for critical defect is less costly. ) An item containing the major<br />
defects will be discarded at a cost of Rs.1.50 and an item containing minor defects can be<br />
resold to another consumer at a reduced price such that the cost of rejection in this case<br />
is around Rs.0.50. An item containing defects of major category, if found during filling<br />
at the consumer’s end, costs the producer around Rs.5.50 ( price of the product ) and a<br />
product containing minor defects will cost the producer around Rs.3.20 ( manufacturing<br />
cost + transportation costs ).<br />
Using the notation of cost model we find that the cost parameters are S 0 = R 0 =<br />
0.20, S 1 = R 1 = 1.50, R 2 = S 2 = 0.50, A 1 = 5.50 and A 2 = 3.20. From the past data<br />
we compute the ¯p 1 = 0.0105, ¯p 2 = 0.035 and Standard deviations as 0.0091 and 0.0055 respectively,<br />
so that the parameters of the gamma priors s 1 and s 2 work out to be around 1.2<br />
and 40 respectively. This gives k s ′ = 0.05, d 0 = 0.05, d 1 = 1, d 2 = 0.675.<br />
We now construct optimal A kind, D kind and C kind <strong>plans</strong> minimizing the cost function<br />
[K(N, n)/(A 1 − R 1 )]. The table 3.1.4 gives the optimal A, C and D <strong>plans</strong> for lot sizes 20000<br />
(10000) 50000.<br />
We observe that optimal A kind <strong>plans</strong> are cheaper than the optimal C kind <strong>plans</strong> and the<br />
optimal D kind <strong>plans</strong>. The optimal C kind <strong>plans</strong> are cheaper than the optimal D kind <strong>plans</strong>.<br />
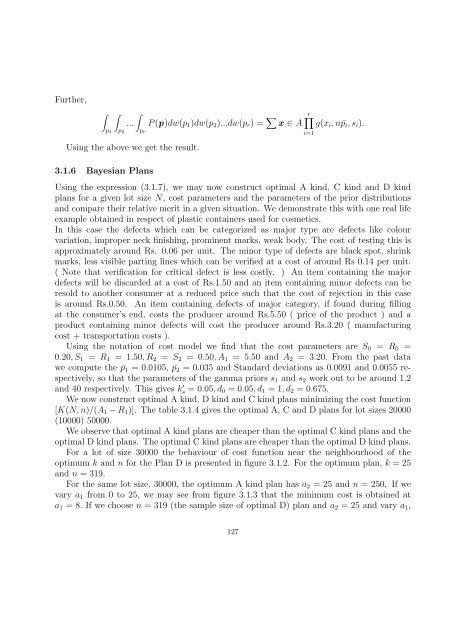
For a lot of size 30000 the behaviour of cost function near the neighbourhood of the<br />
optimum k and n for the Plan D is presented in figure 3.1.2. For the optimum plan, k = 25<br />
and n = 319.<br />
For the same lot size, 30000, the optimum A kind plan has a 2 = 25 and n = 250. If we<br />
vary a 1 from 0 to 25, we may see from figure 3.1.3 that the minimum cost is obtained at<br />
a 1 = 8. If we choose n = 319 (the sample size of optimal D) plan and a 2 = 25 and vary a 1 ,<br />
127