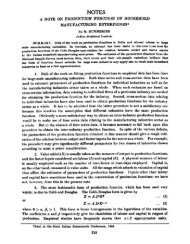
Multiattribute acceptance sampling plans - Library(ISI Kolkata ...
Multiattribute acceptance sampling plans - Library(ISI Kolkata ...
Multiattribute acceptance sampling plans - Library(ISI Kolkata ...

Create successful ePaper yourself
Turn your PDF publications into a flip-book with our unique Google optimized e-Paper software.
2.2 The expected cost model for discrete prior distributions<br />
2.2.1 Assumptions<br />
By Bayesian <strong>plans</strong> we understand the <strong>plans</strong> obtained by minimizing average costs which<br />
has three identifiable components viz. inspection costs, <strong>acceptance</strong> costs, and rejection<br />
costs. For these <strong>plans</strong> the process average defective is taken to be a random variable. In<br />
our present context the prior distribution (i.e. the distribution of process average) is the<br />
expected distribution of lot quality vector on which the <strong>sampling</strong> plan is going to operate.<br />
For the multiattribute Bayesian <strong>plans</strong> considered by others [See chapter 2.1], the process<br />
average for each attribute has been assumed to follow a beta distribution so that the lot<br />
quality distribution for each attribute becomes a beta binomial.Thus, in a situation when<br />
defect occurrences are jointly independent the product of individual beta distributions are<br />
chosen as an appropriate prior.<br />
We may, however, note that even when the process is in control with respect to such a<br />
prior, the process will occasionally go out of control and some lots of poorer quality will be<br />
produced before the process gets corrected. We then have a situation of a beta prior with<br />
outliers.<br />
As an alternative to these models, consider the process average vector as a random variable<br />
which may take on two values,(p 1 , p 2 , ..., p r ) and (p ′ 1, p ′ 2, ..., p ′ r), a satisfactory and an<br />
unsatisfactory quality level with given probabilities. This two point prior may be considered<br />
as a simplification of the one point prior with outliers, because the model contains some<br />
information about the distribution of the outlier. When the process performs at an unsatisfactory<br />
level it generally happens (e.g. for a manufacturing operation) that the quality level<br />
is poor for all the attributes. We cite one example from a real life situation.<br />
2.2.2 A real life example<br />
The example given below constitutes a typical example picked up from the author’s list<br />
of similar applications in factories rendered by him as a QC professional. For the general<br />
discussion intended here, the details relating to the particular application are not included<br />
and only the relevant calculations are presented.<br />
A company manufactures about 1.5 lakhs of 25 mm RS closures in a shift. A shift’s<br />
production by a group is being packed in cartons, each carton is considered as an inspection<br />
lot for verification after the end of the shift. The two important sets of attributes for the<br />
product are functional defects and surface defects. On the spot observations have been made<br />
using a p-chart data format on these attributes.<br />
In a typical scenario one observes, that most of the time the process is stable at a certain<br />
86