Multiattribute acceptance sampling plans - Library(ISI Kolkata ...
Multiattribute acceptance sampling plans - Library(ISI Kolkata ...
Multiattribute acceptance sampling plans - Library(ISI Kolkata ...

Create successful ePaper yourself
Turn your PDF publications into a flip-book with our unique Google optimized e-Paper software.
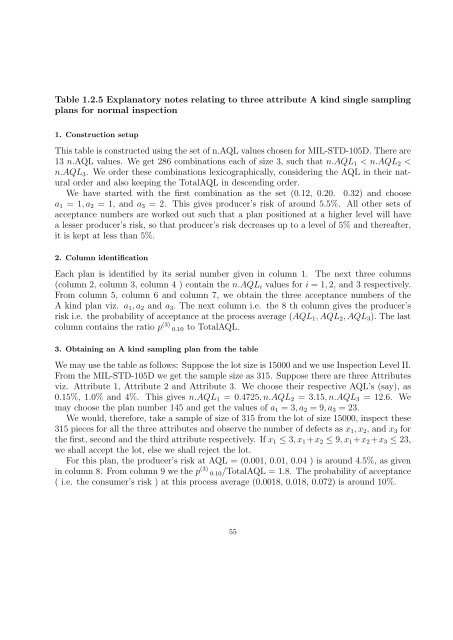
Table 1.2.5 Explanatory notes relating to three attribute A kind single <strong>sampling</strong><br />
<strong>plans</strong> for normal inspection<br />
1. Construction setup<br />
This table is constructed using the set of n.AQL values chosen for MIL-STD-105D. There are<br />
13 n.AQL values. We get 286 combinations each of size 3, such that n.AQL 1 < n.AQL 2 <<br />
n.AQL 3 . We order these combinations lexicographically, considering the AQL in their natural<br />
order and also keeping the TotalAQL in descending order.<br />
We have started with the first combination as the set (0.12, 0.20. 0.32) and choose<br />
a 1 = 1, a 2 = 1, and a 3 = 2. This gives producer’s risk of around 5.5%. All other sets of<br />
<strong>acceptance</strong> numbers are worked out such that a plan positioned at a higher level will have<br />
a lesser producer’s risk, so that producer’s risk decreases up to a level of 5% and thereafter,<br />
it is kept at less than 5%.<br />
2. Column identification<br />
Each plan is identified by its serial number given in column 1. The next three columns<br />
(column 2, column 3, column 4 ) contain the n.AQL i values for i = 1, 2, and 3 respectively.<br />
From column 5, column 6 and column 7, we obtain the three <strong>acceptance</strong> numbers of the<br />
A kind plan viz. a 1 , a 2 and a 3 . The next column i.e. the 8 th column gives the producer’s<br />
risk i.e. the probability of <strong>acceptance</strong> at the process average (AQL 1 , AQL 2 , AQL 3 ). The last<br />
column contains the ratio p (3) 0.10 to TotalAQL.<br />
3. Obtaining an A kind <strong>sampling</strong> plan from the table<br />
We may use the table as follows: Suppose the lot size is 15000 and we use Inspection Level II.<br />
From the MIL-STD-105D we get the sample size as 315. Suppose there are three Attributes<br />
viz. Attribute 1, Attribute 2 and Attribute 3. We choose their respective AQL’s (say), as<br />
0.15%, 1.0% and 4%. This gives n.AQL 1 = 0.4725, n.AQL 2 = 3.15, n.AQL 3 = 12.6. We<br />
may choose the plan number 145 and get the values of a 1 = 3, a 2 = 9, a 3 = 23.<br />
We would, therefore, take a sample of size of 315 from the lot of size 15000, inspect these<br />
315 pieces for all the three attributes and observe the number of defects as x 1 , x 2 , and x 3 for<br />
the first, second and the third attribute respectively. If x 1 ≤ 3, x 1 +x 2 ≤ 9, x 1 +x 2 +x 3 ≤ 23,<br />
we shall accept the lot, else we shall reject the lot.<br />
For this plan, the producer’s risk at AQL = (0.001, 0.01, 0.04 ) is around 4.5%, as given<br />
in column 8. From column 9 we the p (3) 0.10/TotalAQL = 1.8. The probability of <strong>acceptance</strong><br />
( i.e. the consumer’s risk ) at this process average (0.0018, 0.018, 0.072) is around 10%.<br />
55