download (pdf, 6MB) - SNV
download (pdf, 6MB) - SNV
download (pdf, 6MB) - SNV

Create successful ePaper yourself
Turn your PDF publications into a flip-book with our unique Google optimized e-Paper software.
would be available since the number of animals also include households with only one cattle or buffalo and<br />
hence do not have enough dung volume to feed the smallest size biogas plant (4 m 3 ) which requires 24 kg of<br />
dung per day. These calculations do not take account of the dung available from poultry and other domestic<br />
animals such as pigs and goats. A quick review on above data will reveal that there would be potential of 2.9<br />
million biogas plants in Nepal. In 1992, based upon the potential of biogas plants in the plains, hills and<br />
mountain, Wim J. van Nes had calculated the potential of establishing 1.3 million in the Kingdom of Nepal.<br />
On the other hand, although the assumptions on the technical potential may range between 1.3 and 2.9<br />
million plants (CMS and <strong>SNV</strong>/BSP), the economical potential is considered to be 600,000 plants.<br />
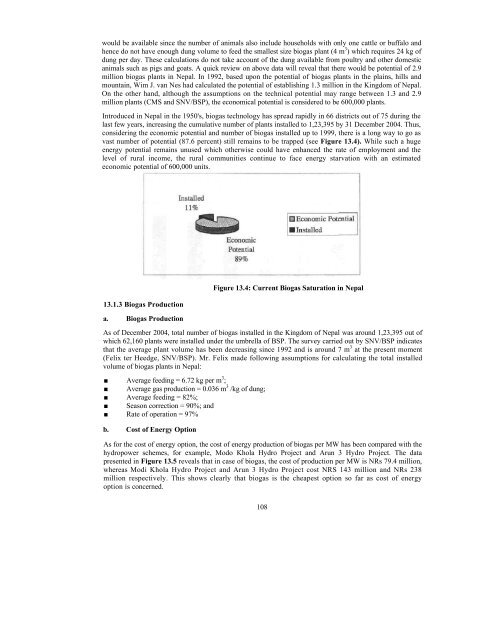
Introduced in Nepal in the 1950's, biogas technology has spread rapidly in 66 districts out of 75 during the<br />
last few years, increasing the cumulative number of plants installed to 1,23,395 by 31 December 2004. Thus,<br />
considering the economic potential and number of biogas installed up to 1999, there is a long way to go as<br />
vast number of potential (87.6 percent) still remains to be trapped (see Figure 13.4). While such a huge<br />
energy potential remains unused which otherwise could have enhanced the rate of employment and the<br />
level of rural income, the rural communities continue to face energy starvation with an estimated<br />
economic potential of 600,000 units.<br />
13.1.3 Biogas Production<br />
a. Biogas Production<br />
Figure 13.4: Current Biogas Saturation in Nepal<br />
As of December 2004, total number of biogas installed in the Kingdom of Nepal was around 1,23,395 out of<br />
which 62,160 plants were installed under the umbrella of BSP. The survey carried out by <strong>SNV</strong>/BSP indicates<br />
that the average plant volume has been decreasing since 1992 and is around 7 m 3 at the present moment<br />
(Felix ter Heedge, <strong>SNV</strong>/BSP). Mr. Felix made following assumptions for calculating the total installed<br />
volume of biogas plants in Nepal:<br />
■ Average feeding = 6.72 kg per m 3 ;<br />
■ Average gas production = 0.036 m 3 /kg of dung;<br />
■ Average feeding = 82%;<br />
■ Season correction = 90%; and<br />
■ Rate of operation = 97%<br />
b. Cost of Energy Option<br />
As for the cost of energy option, the cost of energy production of biogas per MW has been compared with the<br />
hydropower schemes, for example, Modo Khola Hydro Project and Arun 3 Hydro Project. The data<br />
presented in Figure 13.5 reveals that in case of biogas, the cost of production per MW is NRs 79.4 million,<br />
whereas Modi Khola Hydro Project and Arun 3 Hydro Project cost NRS 143 million and NRs 238<br />
million respectively. This shows clearly that biogas is the cheapest option so far as cost of energy<br />
option is concerned.<br />
108