download (pdf, 6MB) - SNV
download (pdf, 6MB) - SNV
download (pdf, 6MB) - SNV

Create successful ePaper yourself
Turn your PDF publications into a flip-book with our unique Google optimized e-Paper software.
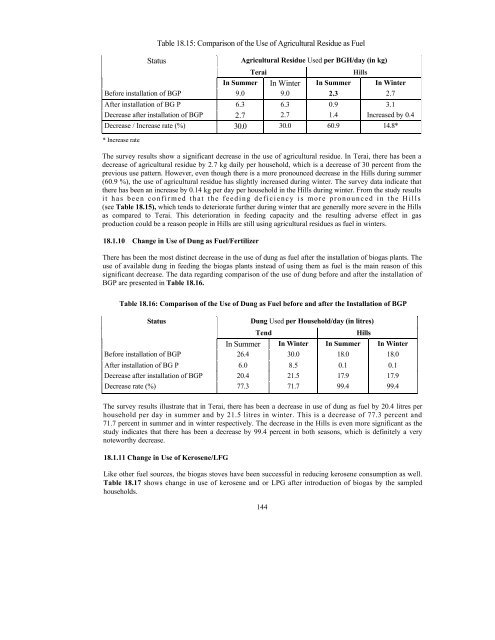
Status<br />
Table 18.15: Comparison of the Use of Agricultural Residue as Fuel<br />
Agricultural Residue Used per BGH/day (in kg)<br />
Terai<br />
Hills<br />
In Summer In Winter In Summer In Winter<br />
Before installation of BGP 9.0 9.0 2.3 2.7<br />
After installation of BG P 6.3 6.3 0.9 3.1<br />
Decrease after installation of BGP 2.7 2.7 1.4 Increased by 0.4<br />
Decrease / Increase rate (%) 30.0 30.0 60.9 14.8*<br />
* Increase rate<br />
The survey results show a significant decrease in the use of agricultural residue. In Terai, there has been a<br />
decrease of agricultural residue by 2.7 kg daily per household, which is a decrease of 30 percent from the<br />
previous use pattern. However, even though there is a more pronounced decrease in the Hills during summer<br />
(60.9 %), the use of agricultural residue has slightly increased during winter. The survey data indicate that<br />
there has been an increase by 0.14 kg per day per household in the Hills during winter. From the study results<br />
it has been confirmed that the feeding deficiency is more pronounced in the Hills<br />
(see Table 18.15), which tends to deteriorate further during winter that are generally more severe in the Hills<br />
as compared to Terai. This deterioration in feeding capacity and the resulting adverse effect in gas<br />
production could be a reason people in Hills are still using agricultural residues as fuel in winters.<br />
18.1.10 Change in Use of Dung as Fuel/Fertilizer<br />
There has been the most distinct decrease in the use of dung as fuel after the installation of biogas plants. The<br />
use of available dung in feeding the biogas plants instead of using them as fuel is the main reason of this<br />
significant decrease. The data regarding comparison of the use of dung before and after the installation of<br />
BGP are presented in Table 18.16.<br />
Table 18.16: Comparison of the Use of Dung as Fuel before and after the Installation of BGP<br />
Status<br />
Dung Used per Household/day (in litres)<br />
Tend<br />
In Summer In Winter In Summer In Winter<br />
Before installation of BGP 26.4 30.0 18.0 18.0<br />
After installation of BG P 6.0 8.5 0.1 0.1<br />
Decrease after installation of BGP 20.4 21.5 17.9 17.9<br />
Decrease rate (%) 77.3 71.7 99.4 99.4<br />
Hills<br />
The survey results illustrate that in Terai, there has been a decrease in use of dung as fuel by 20.4 litres per<br />
household per day in summer and by 21.5 litres in winter. This is a decrease of 77.3 percent and<br />
71.7 percent in summer and in winter respectively. The decrease in the Hills is even more significant as the<br />
study indicates that there has been a decrease by 99.4 percent in both seasons, which is definitely a very<br />
noteworthy decrease.<br />
18.1.11 Change in Use of Kerosene/LFG<br />
Like other fuel sources, the biogas stoves have been successful in reducing kerosene consumption as well.<br />
Table 18.17 shows change in use of kerosene and or LPG after introduction of biogas by the sampled<br />
households.<br />
144