

Liquidity provision in the overnight foreign exchange market
Liquidity provision in the overnight foreign exchange market
Liquidity provision in the overnight foreign exchange market

You also want an ePaper? Increase the reach of your titles
YUMPU automatically turns print PDFs into web optimized ePapers that Google loves.
.012<br />
.004<br />
.008<br />
.000<br />
.004<br />
-.004<br />
.000<br />
-.008<br />
-.004<br />
50 100 150 200 250<br />
-.012<br />
50 100 150 200 250<br />
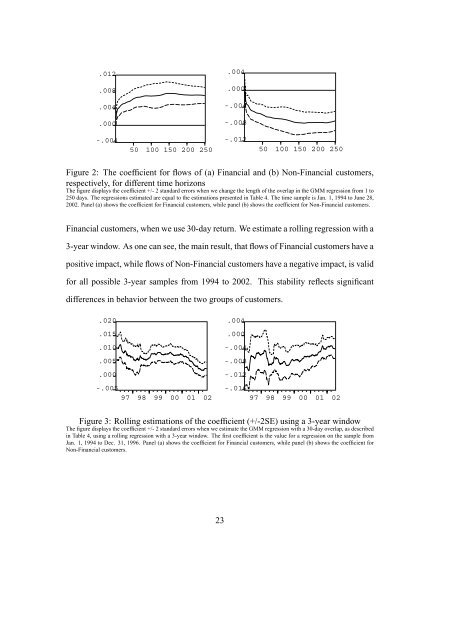
Figure 2: The coefficient for flows of (a) F<strong>in</strong>ancial and (b) Non-F<strong>in</strong>ancial customers,<br />
respectively, for different time horizons<br />
The figure displays <strong>the</strong> coefficient +/- 2 standard errors when we change <strong>the</strong> length of <strong>the</strong> overlap <strong>in</strong> <strong>the</strong> GMM regression from 1 to<br />
250 days. The regressions estimated are equal to <strong>the</strong> estimations presented <strong>in</strong> Table 4. The time sample is Jan. 1, 1994 to June 28,<br />
2002. Panel (a) shows <strong>the</strong> coefficient for F<strong>in</strong>ancial customers, while panel (b) shows <strong>the</strong> coefficient for Non-F<strong>in</strong>ancial customers.<br />
F<strong>in</strong>ancial customers, when we use 30-day return. We estimate a roll<strong>in</strong>g regression with a<br />
3-year w<strong>in</strong>dow. As one can see, <strong>the</strong> ma<strong>in</strong> result, that flows of F<strong>in</strong>ancial customers have a<br />
positive impact, while flows of Non-F<strong>in</strong>ancial customers have a negative impact, is valid<br />
for all possible 3-year samples from 1994 to 2002. This stability reflects significant<br />
differences <strong>in</strong> behavior between <strong>the</strong> two groups of customers.<br />
.020<br />
.015<br />
.010<br />
.005<br />
.000<br />
-.005<br />
97 98 99 00 01 02<br />
.004<br />
.000<br />
-.004<br />
-.008<br />
-.012<br />
-.016<br />
97 98 99 00 01 02<br />
Figure 3: Roll<strong>in</strong>g estimations of <strong>the</strong> coefficient (+/-2SE) us<strong>in</strong>g a 3-year w<strong>in</strong>dow<br />
The figure displays <strong>the</strong> coefficient +/- 2 standard errors when we estimate <strong>the</strong> GMM regression with a 30-day overlap, as described<br />
<strong>in</strong> Table 4, us<strong>in</strong>g a roll<strong>in</strong>g regression with a 3-year w<strong>in</strong>dow. The first coefficient is <strong>the</strong> value for a regression on <strong>the</strong> sample from<br />
Jan. 1, 1994 to Dec. 31, 1996. Panel (a) shows <strong>the</strong> coefficient for F<strong>in</strong>ancial customers, while panel (b) shows <strong>the</strong> coefficient for<br />
Non-F<strong>in</strong>ancial customers.<br />
23


