Thermal, Structural, and Inflation Modeling of an Isotensoid ...
Thermal, Structural, and Inflation Modeling of an Isotensoid ...
Thermal, Structural, and Inflation Modeling of an Isotensoid ...

Create successful ePaper yourself
Turn your PDF publications into a flip-book with our unique Google optimized e-Paper software.
!<br />
where<br />
<strong><strong>an</strong>d</strong><br />
!<br />
N<br />
!" = b<br />
P ref<br />
#R 2 ,<br />
f f<br />
= "f r<br />
(31)<br />
#<br />
" =1+<br />
1 $ % 2 (32)<br />
" = 1# f r<br />
# T r<br />
(33)<br />
Note that γ is strictly greater th<strong>an</strong> one, so the front fabric<br />
stress <strong><strong>an</strong>d</strong> meridi<strong>an</strong> tension will be greater th<strong>an</strong> the rear<br />
values. Equations ! (30) <strong><strong>an</strong>d</strong> (31) show that the peak stresses<br />
occur when the value <strong>of</strong> internal pressure is the highest. It<br />
was shown in the inflation <strong>an</strong>alysis section <strong>of</strong> this paper that<br />
the internal pressure is directly proportional to the<br />
freestream dynamic pressure, so we c<strong>an</strong> fairly assume that<br />
the peak stresses will occur at the full pressure time, t fp . The<br />
burble fence load, N b , at time t f is computed using modified<br />
Newtoni<strong>an</strong> flow theory for a half-torus as 80.8 kN.<br />
Predicted meridional cord loads <strong><strong>an</strong>d</strong> fabric stresses for the<br />
three minimum gauge materials considered are shown in<br />
Table 5. The safety factor is the ratio <strong>of</strong> the material tension<br />
strength to the computed fabric stress. For the meridi<strong>an</strong>s, a<br />
cord diameter <strong>of</strong> 1 cm is assumed for the safety factor<br />
calculation. These results indicate that minimum gauge<br />
materials are more th<strong>an</strong> capable <strong>of</strong> h<strong><strong>an</strong>d</strong>ling the maximum<br />
fabric stresses in the isotensoid. Additionally, meridional<br />
cords c<strong>an</strong> be constructed <strong>of</strong> the same material as the<br />
envelope fabric with plenty <strong>of</strong> margin from failure. Thus,<br />
the material sizing shown in Table 3 is assumed in<br />
subsequent thermal <strong>an</strong>alyses.<br />
Table 5 – Maximum fabric stresses <strong><strong>an</strong>d</strong> safety factors for<br />
c<strong><strong>an</strong>d</strong>idate SIAD materials. Cord safety factor assumes a<br />
1 cm diameter meridi<strong>an</strong>.<br />
Tensile<br />
Strength<br />
(MPa)<br />
Cord<br />
Load<br />
(N)<br />
Cord<br />
Safety<br />
Factor<br />
Fabric<br />
Stress<br />
(MPa)<br />
Fabric<br />
Safety<br />
Factor<br />
Material<br />
Nomex 600 5972 8 13 46<br />
Kevlar 3600 5972 47 21 174<br />
Vectr<strong>an</strong> 3000 5972 39 21 145<br />
<strong>Thermal</strong> Analysis<br />
<strong>Structural</strong> <strong>an</strong>alysis shows that minimum gauge materials c<strong>an</strong><br />
perform suitably, so the temperature history <strong>of</strong> the c<strong>an</strong>opy<br />
c<strong>an</strong> now be computed using the thermal model discussed<br />
earlier. It is <strong>of</strong> primary interest to deduce whether or not the<br />
fabric temperature will exceed the thermal capability <strong>of</strong> the<br />
stressed materials. Also <strong>of</strong> interest is the sensitivity <strong>of</strong> the<br />
temperature results to different thicknesses <strong>of</strong> elastomeric<br />
12<br />
coating. Underst<strong><strong>an</strong>d</strong>ing this relationship informs parametric<br />
SIAD mass models requiring coating thickness as <strong>an</strong> input.<br />
The maximum temperature in the fabric as a function <strong>of</strong><br />
thermal coating density is shown in Table 6. Note that<br />
adding a modest amount <strong>of</strong> coating c<strong>an</strong> greatly reduce peak<br />
temperatures. This addition adds thermal mass, ρc p , to the<br />
material stack <strong><strong>an</strong>d</strong> effectively raises the amount <strong>of</strong> energy<br />
required to increase the fabric temperature.<br />
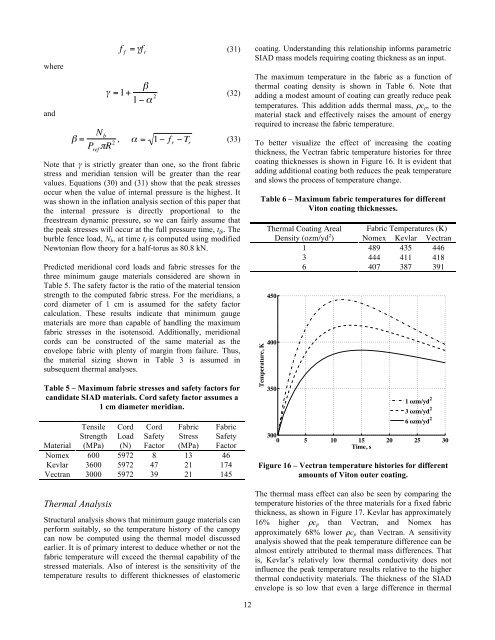
To better visualize the effect <strong>of</strong> increasing the coating<br />
thickness, the Vectr<strong>an</strong> fabric temperature histories for three<br />
coating thicknesses is shown in Figure 16. It is evident that<br />
adding additional coating both reduces the peak temperature<br />
<strong><strong>an</strong>d</strong> slows the process <strong>of</strong> temperature ch<strong>an</strong>ge.<br />
Temperature, K<br />
Table 6 – Maximum fabric temperatures for different<br />
Viton coating thicknesses.<br />
<strong>Thermal</strong> Coating Areal<br />
Density (ozm/yd 2 )<br />
450<br />
400<br />
350<br />
Fabric Temperatures (K)<br />
Nomex Kevlar Vectr<strong>an</strong><br />
1 489 435 446<br />
3 444 411 418<br />
6 407 387 391<br />
1 ozm/yd 2<br />
3 ozm/yd 2<br />
6 ozm/yd 2<br />
300<br />
0 5 10 15 20 25 30<br />
Time, s<br />
Figure 16 – Vectr<strong>an</strong> temperature histories for different<br />
amounts <strong>of</strong> Viton outer coating.<br />
The thermal mass effect c<strong>an</strong> also be seen by comparing the<br />
temperature histories <strong>of</strong> the three materials for a fixed fabric<br />
thickness, as shown in Figure 17. Kevlar has approximately<br />
16% higher ρc p th<strong>an</strong> Vectr<strong>an</strong>, <strong><strong>an</strong>d</strong> Nomex has<br />
approximately 68% lower ρc p th<strong>an</strong> Vectr<strong>an</strong>. A sensitivity<br />
<strong>an</strong>alysis showed that the peak temperature difference c<strong>an</strong> be<br />
almost entirely attributed to thermal mass differences. That<br />
is, Kevlar’s relatively low thermal conductivity does not<br />
influence the peak temperature results relative to the higher<br />
thermal conductivity materials. The thickness <strong>of</strong> the SIAD<br />
envelope is so low that even a large difference in thermal