Thermal, Structural, and Inflation Modeling of an Isotensoid ...
Thermal, Structural, and Inflation Modeling of an Isotensoid ...
Thermal, Structural, and Inflation Modeling of an Isotensoid ...

Create successful ePaper yourself
Turn your PDF publications into a flip-book with our unique Google optimized e-Paper software.
15000<br />
10000<br />
5000<br />
15000<br />
10000<br />
5000<br />
15000<br />
10000<br />
5000<br />
Time, sec<br />
0<br />
0 0.1 0.2 0.3 0.4<br />
Time, sec<br />
0<br />
0 0.1 0.2 0.3 0.4<br />
Time, sec<br />
element <strong>of</strong> ram-air inflation. Thus, a simple model is<br />
suggested that tracks the rise in drag area as proportional to<br />
the rise in internal pressure:<br />
These results, though limited, provide some confidence in<br />
the current inflation model.<br />
C D<br />
A = ( C D<br />
A) aeroshell<br />
+ P i<br />
P 02<br />
"<br />
#( C D<br />
A) IAD<br />
! C D<br />
A<br />
( ) aeroshell<br />
$<br />
%<br />
(13)<br />
2<br />
where the subscript “aeroshell” refers to the drag area <strong>of</strong> the<br />
entry vehicle without the IAD deployed <strong><strong>an</strong>d</strong> the subscript<br />
“IAD” refers to the drag area <strong>of</strong> the vehicle with a fully<br />
deployed IAD. The basis for this model comes from<br />
Reference [8], where traces <strong>of</strong> internal pressure <strong><strong>an</strong>d</strong> drag<br />
force produced during inflation are shown to be very similar<br />
in shape.<br />
p i<br />
/q !<br />
1.5<br />
1<br />
0.5<br />
Model 1A<br />
Model 1B<br />
Model 1C<br />
Model IIA<br />
Model IIB<br />
Model Validation<br />
An attempt to validate the proposed inflation <strong><strong>an</strong>d</strong> drag area<br />
models was made using wind tunnel data provided in the<br />
references. Specifically, References [4] <strong><strong>an</strong>d</strong> [8] provide<br />
internal pressure <strong><strong>an</strong>d</strong> drag force traces versus time that are<br />
used to compare against.<br />
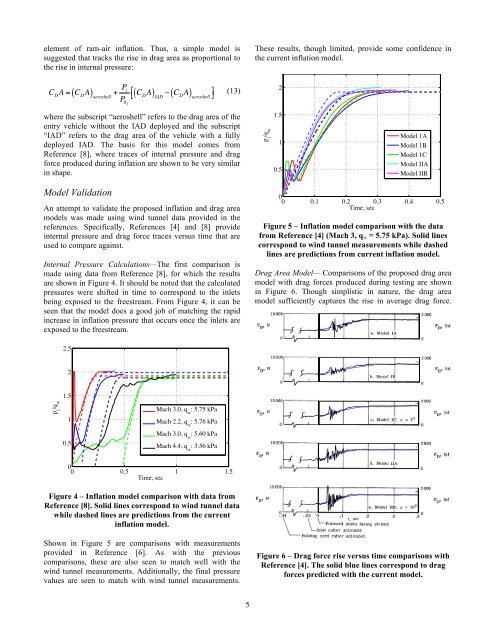
Internal Pressure Calculations—The first comparison is<br />
made using data from Reference [8], for which the results<br />
are shown in Figure 4. It should be noted that the calculated<br />
pressures were shifted in time to correspond to the inlets<br />
being exposed to the freestream. From Figure 4, it c<strong>an</strong> be<br />
seen that the model does a good job <strong>of</strong> matching the rapid<br />
increase in inflation pressure that occurs once the inlets are<br />
exposed to the freestream.<br />
2.5<br />
0<br />
0 0.1 0.2 0.3 0.4 0.5<br />
Time, sec<br />
Figure 5 – <strong>Inflation</strong> model comparison with the data<br />
from Reference [4] (Mach 3, q ∞ = 5.75 kPa). Solid lines<br />
correspond to wind tunnel measurements while dashed<br />
lines are predictions from current inflation model.<br />
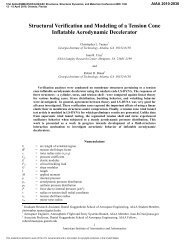
Drag Area Model— Comparisons <strong>of</strong> the proposed drag area<br />
model with drag forces produced during testing are shown<br />
in Figure 6. Though simplistic in nature, the drag area<br />
model sufficiently captures the rise in average drag force.<br />
Drag Force, N<br />
15000<br />
10000<br />
5000<br />
Model<br />
0<br />
0 0.1 0.2 0.3 0.4<br />
Time, sec<br />
IA<br />
[<br />
3 000<br />
FD_<br />
lbf<br />
3 000<br />
2<br />
FD ,<br />
Drag Force, N<br />
FD,<br />
lbf<br />
0<br />
0 0.1 0.2 0.3 0.4<br />
p i<br />
/q !<br />
1.5<br />
1<br />
0.5<br />
Mach 3.0, q !<br />
: 5.75 kPa<br />
Mach 2.2, q !<br />
: 5.76 kPa<br />
Mach 3.0, q !<br />
: 5.60 kPa<br />
Mach 4.4, q !<br />
: 3.56 kPa<br />
0<br />
0 0.5 1 1.5<br />
Time, sec<br />
FD,<br />
FD,<br />
15000<br />
N<br />
15000<br />
N<br />
o _/<br />
Drag Force, N<br />
Drag Force, N<br />
15000<br />
10000<br />
5000<br />
I<br />
3 000<br />
.f"<br />
c. Model IC; a : 5 °<br />
d. Model IIA<br />
]<br />
l 0<br />
0<br />
0 0.1 0.2 0.3 0.4<br />
Time, sec<br />
I<br />
3 000<br />
0<br />
FD,<br />
lbf<br />
F D , ibf<br />
Figure 4 – <strong>Inflation</strong> model comparison with data from<br />
Reference [8]. Solid lines correspond to wind tunnel data<br />
while dashed lines are predictions from the current<br />
inflation model.<br />
FD,<br />
15000<br />
N<br />
Drag Force, N<br />
o,44 I<br />
-. -.04 0 .1 .2<br />
C \ ___ t, sec<br />
inlets Forward facing stream<br />
r<br />
e. Model IIB; a = 10 °<br />
J<br />
.3 .4<br />
3 000<br />
Shown in Figure 5 are comparisons with measurements<br />
provided in Reference [6]. As with the previous<br />
comparisons, these are also seen to match well with the<br />
wind tunnel measurements. Additionally, the final pressure<br />
values are seen to match with wind tunnel measurements.<br />
32<br />
H o 1d_n:nl: tr: _tut tt: }::iavt::e d<br />
Figure 13.- Axial force during AID deployment. M = 3.0; q = 5750 Pa (120 psi').<br />
6 – Drag force rise versus time comparisons with<br />
Reference [4]. The solid blue lines correspond to drag<br />
forces predicted with the current model.<br />
5