Thermal, Structural, and Inflation Modeling of an Isotensoid ...
Thermal, Structural, and Inflation Modeling of an Isotensoid ...
Thermal, Structural, and Inflation Modeling of an Isotensoid ...

Create successful ePaper yourself
Turn your PDF publications into a flip-book with our unique Google optimized e-Paper software.
conductivity amounts to little ch<strong>an</strong>ge in the temperature<br />
results.<br />
Temperature, K<br />
500<br />
480<br />
460<br />
440<br />
420<br />
400<br />
380<br />
360<br />
340<br />
320<br />
Nomex<br />
Kevlar<br />
Vectr<strong>an</strong><br />
300<br />
0 5 10 15 20 25 30<br />
Time, s<br />
Figure 17 – Fabric temperature histories for Nomex,<br />
Kevlar, <strong><strong>an</strong>d</strong> Vectr<strong>an</strong> with 1 ozm/yd 2 <strong>of</strong> Viton coating.<br />
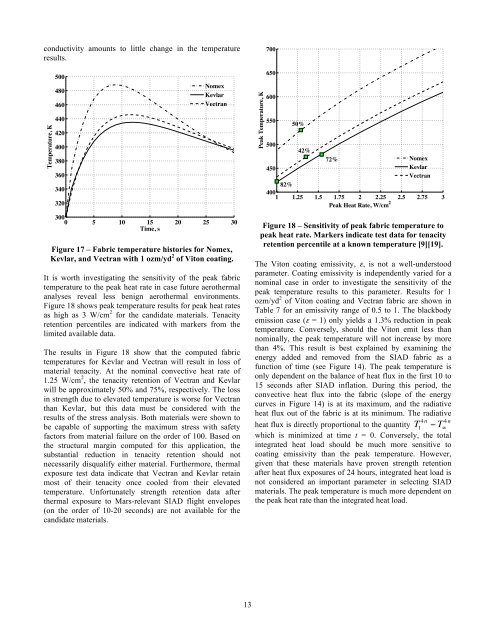
It is worth investigating the sensitivity <strong>of</strong> the peak fabric<br />
temperature to the peak heat rate in case future aerothermal<br />
<strong>an</strong>alyses reveal less benign aerothermal environments.<br />
Figure 18 shows peak temperature results for peak heat rates<br />
as high as 3 W/cm 2 for the c<strong><strong>an</strong>d</strong>idate materials. Tenacity<br />
retention percentiles are indicated with markers from the<br />
limited available data.<br />
The results in Figure 18 show that the computed fabric<br />
temperatures for Kevlar <strong><strong>an</strong>d</strong> Vectr<strong>an</strong> will result in loss <strong>of</strong><br />
material tenacity. At the nominal convective heat rate <strong>of</strong><br />
1.25 W/cm 2 , the tenacity retention <strong>of</strong> Vectr<strong>an</strong> <strong><strong>an</strong>d</strong> Kevlar<br />
will be approximately 50% <strong><strong>an</strong>d</strong> 75%, respectively. The loss<br />
in strength due to elevated temperature is worse for Vectr<strong>an</strong><br />
th<strong>an</strong> Kevlar, but this data must be considered with the<br />
results <strong>of</strong> the stress <strong>an</strong>alysis. Both materials were shown to<br />
be capable <strong>of</strong> supporting the maximum stress with safety<br />
factors from material failure on the order <strong>of</strong> 100. Based on<br />
the structural margin computed for this application, the<br />
subst<strong>an</strong>tial reduction in tenacity retention should not<br />
necessarily disqualify either material. Furthermore, thermal<br />
exposure test data indicate that Vectr<strong>an</strong> <strong><strong>an</strong>d</strong> Kevlar retain<br />
most <strong>of</strong> their tenacity once cooled from their elevated<br />
temperature. Unfortunately strength retention data after<br />
thermal exposure to Mars-relev<strong>an</strong>t SIAD flight envelopes<br />
(on the order <strong>of</strong> 10-20 seconds) are not available for the<br />
c<strong><strong>an</strong>d</strong>idate materials.<br />
Peak Temperature, K<br />
700<br />
650<br />
600<br />
550<br />
50%<br />
500<br />
42%<br />
72%<br />
Nomex<br />
450<br />
Kevlar<br />
Vectr<strong>an</strong><br />
82%<br />
400<br />
1 1.25 1.5 1.75 2 2.25 2.5 2.75 3<br />
Peak Heat Rate, W/cm 2<br />
Figure 18 – Sensitivity <strong>of</strong> peak fabric temperature to<br />
peak heat rate. Markers indicate test data for tenacity<br />
retention percentile at a known temperature [9][19].<br />
The Viton coating emissivity, ε, is not a well-understood<br />
parameter. Coating emissivity is independently varied for a<br />
nominal case in order to investigate the sensitivity <strong>of</strong> the<br />
peak temperature results to this parameter. Results for 1<br />
ozm/yd 2 <strong>of</strong> Viton coating <strong><strong>an</strong>d</strong> Vectr<strong>an</strong> fabric are shown in<br />
Table 7 for <strong>an</strong> emissivity r<strong>an</strong>ge <strong>of</strong> 0.5 to 1. The blackbody<br />
emission case (ε = 1) only yields a 1.3% reduction in peak<br />
temperature. Conversely, should the Viton emit less th<strong>an</strong><br />
nominally, the peak temperature will not increase by more<br />
th<strong>an</strong> 4%. This result is best explained by examining the<br />
energy added <strong><strong>an</strong>d</strong> removed from the SIAD fabric as a<br />
function <strong>of</strong> time (see Figure 14). The peak temperature is<br />
only dependent on the bal<strong>an</strong>ce <strong>of</strong> heat flux in the first 10 to<br />
15 seconds after SIAD inflation. During this period, the<br />
convective heat flux into the fabric (slope <strong>of</strong> the energy<br />
curves in Figure 14) is at its maximum, <strong><strong>an</strong>d</strong> the radiative<br />
heat flux out <strong>of</strong> the fabric is at its minimum. The radiative<br />
heat flux is directly proportional to the qu<strong>an</strong>tity T 4n 4 n<br />
1<br />
" T #<br />
which is minimized at time t = 0. Conversely, the total<br />
integrated heat load should be much more sensitive to<br />
coating emissivity th<strong>an</strong> the peak temperature. However,<br />
given that these materials have proven<br />
!<br />
strength retention<br />
after heat flux exposures <strong>of</strong> 24 hours, integrated heat load is<br />
not considered <strong>an</strong> import<strong>an</strong>t parameter in selecting SIAD<br />
materials. The peak temperature is much more dependent on<br />
the peak heat rate th<strong>an</strong> the integrated heat load.<br />
13