Thermal, Structural, and Inflation Modeling of an Isotensoid ...
Thermal, Structural, and Inflation Modeling of an Isotensoid ...
Thermal, Structural, and Inflation Modeling of an Isotensoid ...

Create successful ePaper yourself
Turn your PDF publications into a flip-book with our unique Google optimized e-Paper software.
!<br />
!<br />
!<br />
C d i<br />
3<br />
"<br />
= 0.4861 P % "<br />
i<br />
$<br />
# P '<br />
( 0.8274 P % "<br />
i<br />
$<br />
02 & # P '<br />
+ .0992 P %<br />
i<br />
$<br />
02 & # P ' + 0.85 (7)<br />
02 &<br />
The inlet efficiency parameter is a function <strong>of</strong> how the inlet<br />
is made <strong><strong>an</strong>d</strong> what the shape is. From Reference [6], <strong>an</strong> η i<br />
value <strong>of</strong> 0.7 is recommended for a cloth inlet like that used<br />
for <strong>an</strong> attached isotensoid.<br />
C<strong>an</strong>opy Porosity Flow Rate—Calculating the mass flow rate<br />
out <strong>of</strong> the c<strong>an</strong>opy due to porosity, !m o<br />
, is performed in a<br />
m<strong>an</strong>ner similar to that for the inlets, though without the inlet<br />
efficiency parameter.<br />
if P %<br />
b<br />
" 1+ # $1 (<br />
# ( 1$# )<br />
' *<br />
P i & 2 )<br />
+<br />
m ˙<br />
- # % 2 (<br />
o = C d o<br />
A base P i - ' *<br />
RT 0 &# +1)<br />
,-<br />
else<br />
+ %<br />
- # '%<br />
m ˙ o = C d o<br />
A base P i - '<br />
RT - 0 '&<br />
, &<br />
P b<br />
P i<br />
2<br />
# +1<br />
1 2<br />
.<br />
# $1<br />
2<br />
0<br />
0<br />
/ 0<br />
(# % P (<br />
* $ ' b<br />
*<br />
) & )<br />
P i<br />
# +1<br />
#<br />
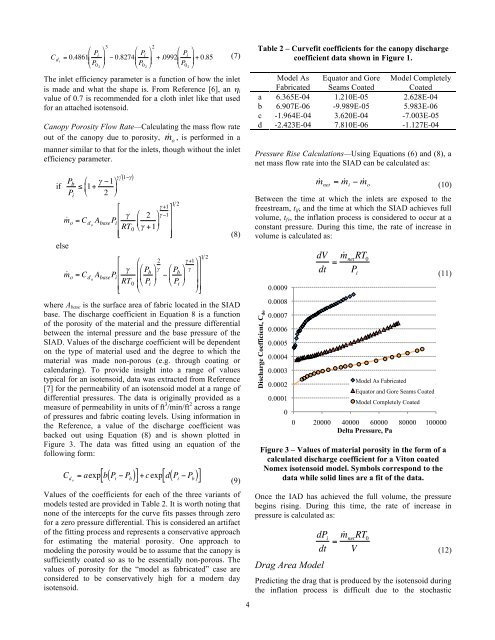
where A base is the surface area <strong>of</strong> fabric located in the SIAD<br />
base. The discharge coefficient in Equation 8 is a function<br />
<strong>of</strong> the porosity <strong>of</strong> the material <strong><strong>an</strong>d</strong> the pressure differential<br />
between the internal pressure <strong><strong>an</strong>d</strong> the base pressure <strong>of</strong> the<br />
SIAD. Values <strong>of</strong> the discharge coefficient will be dependent<br />
on the type <strong>of</strong> material used <strong><strong>an</strong>d</strong> the degree to which the<br />
material was made non-porous (e.g. through coating or<br />
calendaring). To provide insight into a r<strong>an</strong>ge <strong>of</strong> values<br />
typical for <strong>an</strong> isotensoid, data was extracted from Reference<br />
[7] for the permeability <strong>of</strong> <strong>an</strong> isotensoid model at a r<strong>an</strong>ge <strong>of</strong><br />
differential pressures. The data is originally provided as a<br />
measure <strong>of</strong> permeability in units <strong>of</strong> ft 3 /min/ft 2 across a r<strong>an</strong>ge<br />
<strong>of</strong> pressures <strong><strong>an</strong>d</strong> fabric coating levels. Using information in<br />
the Reference, a value <strong>of</strong> the discharge coefficient was<br />
backed out using Equation (8) <strong><strong>an</strong>d</strong> is shown plotted in<br />
Figure 3. The data was fitted using <strong>an</strong> equation <strong>of</strong> the<br />
following form:<br />
C d o<br />
= aexp b( P i<br />
" P b )<br />
(.<br />
* 0<br />
0<br />
*<br />
)<br />
0<br />
/<br />
1 2<br />
(8)<br />
[ ] + c exp[ d( P i<br />
" P b )] (9)<br />
Values <strong>of</strong> the coefficients for each <strong>of</strong> the three vari<strong>an</strong>ts <strong>of</strong><br />
models tested are provided in Table 2. It is worth noting that<br />
none <strong>of</strong> the intercepts for the curve fits passes through zero<br />
for a zero pressure differential. This is considered <strong>an</strong> artifact<br />
<strong>of</strong> the fitting process <strong><strong>an</strong>d</strong> represents a conservative approach<br />
for estimating the material porosity. One approach to<br />
modeling the porosity would be to assume that the c<strong>an</strong>opy is<br />
sufficiently coated so as to be essentially non-porous. The<br />
values <strong>of</strong> porosity for the “model as fabricated” case are<br />
considered to be conservatively high for a modern day<br />
isotensoid.<br />
4<br />
Table 2 – Curvefit coefficients for the c<strong>an</strong>opy discharge<br />
coefficient data shown in Figure 1.<br />
Model As<br />
Fabricated<br />
Equator <strong><strong>an</strong>d</strong> Gore<br />
Seams Coated<br />
Model Completely<br />
Coated<br />
a 6.365E-04 1.210E-05 2.628E-04<br />
b 6.907E-06 -9.989E-05 5.983E-06<br />
c -1.964E-04 3.620E-04 -7.003E-05<br />
d -2.423E-04 7.810E-06 -1.127E-04<br />
Pressure Rise Calculations—Using Equations (6) <strong><strong>an</strong>d</strong> (8), a<br />
net mass flow rate into the SIAD c<strong>an</strong> be calculated as:<br />
m ˙ net<br />
= m ˙ i<br />
" m ˙ o (10)<br />
Between the time at which the inlets are exposed to the<br />
freestream, t if , <strong><strong>an</strong>d</strong> the time at which the SIAD achieves full<br />
volume, ! t fv , the inflation process is considered to occur at a<br />
const<strong>an</strong>t pressure. During this time, the rate <strong>of</strong> increase in<br />
volume is calculated as:<br />
Discharge Coefficient, C do<br />
0.0009<br />
0.0008<br />
!<br />
0.0007<br />
0.0006<br />
0.0005<br />
0.0004<br />
0.0003<br />
0.0002<br />
0.0001<br />
dV<br />
dt<br />
= m ˙ netRT 0<br />
P i (11)<br />
Figure 3 – Values <strong>of</strong> material porosity in the form <strong>of</strong> a<br />
calculated discharge coefficient for a Viton coated<br />
Nomex isotensoid model. Symbols correspond to the<br />
data while solid lines are a fit <strong>of</strong> the data.<br />
Once the IAD has achieved the full volume, the pressure<br />
begins rising. During this time, the rate <strong>of</strong> increase in<br />
pressure is calculated as:<br />
!<br />
0<br />
dP i<br />
dt<br />
Drag Area Model<br />
Model As Fabricated<br />
Equator <strong><strong>an</strong>d</strong> Gore Seams Coated<br />
Model Completely Coated<br />
0 20000 40000 60000 80000 100000<br />
Delta Pressure, Pa<br />
= m ˙ netRT 0<br />
V (12)<br />
Predicting the drag that is produced by the isotensoid during<br />
the inflation process is difficult due to the stochastic