Mercury Software User Manual - MicroDAQ.com
Mercury Software User Manual - MicroDAQ.com
Mercury Software User Manual - MicroDAQ.com

You also want an ePaper? Increase the reach of your titles
YUMPU automatically turns print PDFs into web optimized ePapers that Google loves.
<strong>User</strong> <strong>Manual</strong> for<br />
<strong>Mercury</strong><br />
Graphic Supporting <strong>Software</strong><br />
Vatnagardar 14<br />
104 Reykjavík<br />
Iceland<br />
Tel: +354 533 6060<br />
Fax: +354 533 6069<br />
star-oddi@star-oddi.<strong>com</strong><br />
www.star-oddi.<strong>com</strong>
<strong>User</strong> <strong>Manual</strong><br />
<strong>Mercury</strong> Graphic Supporting <strong>Software</strong><br />
@Star-Oddi 2010. All Rights Reserved
<strong>User</strong> <strong>Manual</strong><br />
<strong>Mercury</strong> Graphic Supporting <strong>Software</strong><br />
Table of Contents<br />
1. Introduction ................................................................................................5<br />
2. Program Installation...................................................................................7<br />
2.1 Install ........................................................................................................7<br />
2.2 Uninstall....................................................................................................7<br />
3. Preparation .................................................................................................9<br />
3.1 Select Recorder Type ...............................................................................9<br />
3.2 Configuration of the Communication Port ...............................................10<br />
3.3 Using the USB Serial Converter .............................................................11<br />
4. Communication Box.................................................................................13<br />
4.1 Communication Box................................................................................13<br />
4.2 Connection Point ....................................................................................14<br />
4.3 COM Connection ....................................................................................15<br />
4.4 Com Port Wizard ....................................................................................16<br />
5. Using DST - Tutorial.................................................................................17<br />
5.1 <strong>Mercury</strong> Set Up.......................................................................................17<br />
6. View Data ..................................................................................................25<br />
6.1 Open Data ..............................................................................................25<br />
6.2 Import......................................................................................................26<br />
6.3 Buttons....................................................................................................26<br />
6.4 Using the Mouse.....................................................................................30<br />
6.5 The View Menu.......................................................................................31<br />
6.6 Opening Data in Excel ............................................................................37<br />
7. Printing......................................................................................................39<br />
7.1 Charts .....................................................................................................39<br />
7.2 Histogram ...............................................................................................40<br />
7.3 Files ........................................................................................................42<br />
8. Settings .....................................................................................................43<br />
8.1 Directories...............................................................................................43<br />
8.2 Preferences ............................................................................................44<br />
8.3 Connection..............................................................................................47<br />
8.4 Retrieve Data..........................................................................................48<br />
8.5 Re-Conversion........................................................................................49<br />
8.6 Out Of Range..........................................................................................50<br />
8.7 Time Synchronize Data (TSD) ................................................................52<br />
8.8 Rate Of Change (ROC)...........................................................................54<br />
8.9 Chart.......................................................................................................55<br />
8.10 Timeline...............................................................................................68<br />
8.11 Templates ...........................................................................................70<br />
9. Multiple Intervals ......................................................................................75<br />
9.1 Start time ................................................................................................76<br />
9.2 Measurement Interval .............................................................................76<br />
10. Reconvert Data .........................................................................................79<br />
10.1 Data Definition.....................................................................................79<br />
10.2 Temperature Definition........................................................................82<br />
10.3 Single Spike Correction.......................................................................83<br />
11 Recorder Modes .......................................................................................87<br />
11.1 PC Mode .............................................................................................87<br />
@Star-Oddi 2010. All Rights Reserved
<strong>User</strong> <strong>Manual</strong><br />
<strong>Mercury</strong> Graphic Supporting <strong>Software</strong><br />
11.2 Sleep Mode .........................................................................................87<br />
11.3 Measurement Mode ............................................................................87<br />
12 Memory Organization...............................................................................89<br />
Appendix..............................................................................................................91<br />
A.1 Directories and Files ...............................................................................91<br />
A.2 Help Menu ..............................................................................................97<br />
A.3 Recorder Backup ....................................................................................98<br />
@Star-Oddi 2010. All Rights Reserved
<strong>User</strong> <strong>Manual</strong><br />
<strong>Mercury</strong> Graphic Supporting <strong>Software</strong><br />
1.Introduction<br />
<strong>Mercury</strong> is supporting software for the DST temperature recording Data<br />
Storage Tag. <strong>Mercury</strong> can run under Win98, WinNT, Win2000, WinXP<br />
and Vista. This manual takes you step-by-step through the program<br />
installation, hardware connections and use of the <strong>Mercury</strong> Program.<br />
This manual guides the users of DST through the operation of the<br />
recorder. Setting the operating parameters as well as data retrieval<br />
requires access to a PC <strong>com</strong>puter with a standard RS-232C serial<br />
interface or USB.<br />
The users of <strong>Mercury</strong> will receive free updates of the software. Updates<br />
of <strong>Mercury</strong> will be available for free download at:<br />
http://www.star-oddi.<strong>com</strong>/Online-Support/<strong>Software</strong>-updates/.<br />
Please note that the downloaded file has to be installed into the existing<br />
<strong>Mercury</strong> folder. The update alone is not a <strong>com</strong>plete program and therefore<br />
will not work like that. Follow the instructions on the update website for<br />
correct installation.<br />
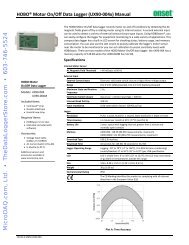
DST is a <strong>com</strong>pact microprocessor-controlled temperature recorder with<br />
electronics housed in a waterproof housing.<br />
The temperature sensor is located behind the membrane as shown on the<br />
diagram below.<br />
Temperature Sensor<br />
Figure 1.1 Temperature sensor<br />
@Star-Oddi 2010. All Rights Reserved
<strong>User</strong> <strong>Manual</strong><br />
<strong>Mercury</strong> Graphic Supporting <strong>Software</strong><br />
@Star-Oddi 2010. All Rights Reserved
<strong>User</strong> <strong>Manual</strong><br />
<strong>Mercury</strong> Graphic Supporting <strong>Software</strong><br />
2.Program Installation<br />
This chapter describes how to install and uninstall the <strong>Mercury</strong> software<br />
on your PC <strong>com</strong>puter.<br />
2.1 Install<br />
The installation program is on the <strong>Mercury</strong> CD. Insert the CD into your<br />
<strong>com</strong>pact disc drive. To install the program, follow the automatic<br />
InstallShield Wizard.<br />
Follow the instructions on the screen. You will be prompted for a directory<br />
name for your <strong>Mercury</strong> program.<br />
2.2 Uninstall<br />
To uninstall the program, do the following:<br />
1. Click on the Start button in Windows.<br />
2. Go to Settings and Control Panel.<br />
3. Choose Add/Remove Programs.<br />
4. Choose <strong>Mercury</strong> and click on Change/Remove, and ‘Yes to all’.<br />
@Star-Oddi 2010. All Rights Reserved
<strong>User</strong> <strong>Manual</strong><br />
<strong>Mercury</strong> Graphic Supporting <strong>Software</strong><br />
@Star-Oddi 2010. All Rights Reserved
<strong>User</strong> <strong>Manual</strong><br />
<strong>Mercury</strong> Graphic Supporting <strong>Software</strong><br />
3.Preparation<br />
This chapter describes preparations that should be carried out before<br />
connecting to the recorder.<br />
Start <strong>Mercury</strong> and the following window appears:<br />
Figure 3.1 <strong>Mercury</strong> Main Window<br />
3.1 Select Recorder Type<br />
<strong>Mercury</strong> is <strong>com</strong>patible with other Star-Oddi instruments. A recorder type<br />
must be selected before connecting to the recorder. The default setting in<br />
the software is set to DST micro as a recorder type. Change the recorder<br />
type to your type of DST by doing the following:<br />
1. Choose the File menu and the New Recorder Type <strong>com</strong>mand.<br />
2. Select the appropriate DST as a recorder type.<br />
@Star-Oddi 2010. All Rights Reserved
<strong>User</strong> <strong>Manual</strong><br />
<strong>Mercury</strong> Graphic Supporting <strong>Software</strong><br />
Figure 3.2 Select a new Recorder Type<br />
Before connecting to the recorder, it is important that the clock on the PC<br />
<strong>com</strong>puter is correct. This is important since the recorder automatically<br />
downloads the PC clock settings.<br />
3.2 Configuration of the Communication Port<br />
It is necessary to define which serial port on your PC <strong>com</strong>puter you will<br />
use for connecting the Communication Box. This is done in the following<br />
way:<br />
1. Choose the Communication <strong>com</strong>mand in the Settings menu.<br />
The Communication definition dialog box appears.<br />
2. Select a serial port for <strong>com</strong>munications.<br />
3. Choose the OK button.<br />
Figure 3.3 Communication Port Configuration<br />
@Star-Oddi 2010. All Rights Reserved
<strong>User</strong> <strong>Manual</strong><br />
<strong>Mercury</strong> Graphic Supporting <strong>Software</strong><br />
To check which <strong>com</strong>munication ports are available on your <strong>com</strong>puter,<br />
open your Device Manager. On Windows XP you can do it following way:<br />
Control panel > system > hardware > device manager.<br />
Under Ports you can view all available ports. Make sure that the port you<br />
are intending to use is enabled: right-click on the appropriate port and<br />
select properties. Under ‘Device usage’ it should state ‘use this device<br />
(enable)’.<br />
Figure 3.4 Enable Communication Port<br />
3.3 Using the USB Serial Converter<br />
If you are using the USB serial converter you will need to install the driver<br />
first that <strong>com</strong>es on the provided CD. Please, read the ‚Quick Installation<br />
Guide‘ booklet to get further instruction on how to proceed.<br />
After you plug in the USB cable you will see a new <strong>com</strong>munication port in<br />
your device manager, called ‚Prolific USB-to-Serial Comm Port‘. Make<br />
sure that the port is enabled and select the appropriate port in <strong>Mercury</strong>.<br />
@Star-Oddi 2010. All Rights Reserved
<strong>User</strong> <strong>Manual</strong><br />
<strong>Mercury</strong> Graphic Supporting <strong>Software</strong><br />
Figure 3.5 USB Communication Port in Device Manager<br />
@Star-Oddi 2010. All Rights Reserved
<strong>User</strong> <strong>Manual</strong><br />
<strong>Mercury</strong> Graphic Supporting <strong>Software</strong><br />
4.Communication Box<br />
This chapter provides details concerning the Communication Box and<br />
how to place recorder in the box prior to connection.<br />
4.1 Communication Box<br />
The DST Communication Box is a PC-RS-232C <strong>com</strong>patible<br />
<strong>com</strong>munication interface, specially designed to <strong>com</strong>municate with DST<br />
recorders wirelessly via RF (radio frequency). A USB converter plug is<br />
optionally available for the Communication Box.<br />
The Communication Box has three diodes:<br />
1. Red – shows that power is fed from the power supply to the<br />
Communication Box.<br />
2. Yellow – shows that <strong>Mercury</strong> has made connection with the box,<br />
the appropriate DST has been selected as a recorder type and that<br />
correct COM port has been selected.<br />
3. Green – shows that recorder is in correct position for seeking<br />
connection.<br />
Connect the serial cable between the serial port of the <strong>com</strong>puter and the<br />
Communication Box. Plug the power supply connection to a powersocket.<br />
The voltage from the power supply should be set to 9V, although<br />
there is no damage to use up to 20V. Before inserting the power plug into<br />
the box, it is important to note that the polarity should be:<br />
–(O+(minus on the outside and the plus on the inside)<br />
The polarity is usually shown where the arrows meet on the power plug,<br />
and the power supply. After the power supply has been connected to the<br />
Communication Box, the red light should be on. After <strong>Mercury</strong> has been<br />
started, the yellow light should be on (if correct COM port is selected).<br />
The box will power the recorder while <strong>com</strong>municating with the PC. In<br />
case the battery is dead, the PC and interface are still able to connect to<br />
the recorder and retrieve data.<br />
@Star-Oddi 2010. All Rights Reserved
<strong>User</strong> <strong>Manual</strong><br />
<strong>Mercury</strong> Graphic Supporting <strong>Software</strong><br />
4.2 Connection Point<br />
In order to get the green light, the red and the yellow light must be on.<br />
The recorder is inserted into the hole of the box as shown in the figure<br />
below:<br />
DST<br />
Communication Box<br />
Figure 4.1 Inserting Recorder into the Communication Box<br />
If the recorder is wet/damp, then please wipe it dry before inserting it into<br />
the box. The spherical end of the recorder faces down and flat end faces<br />
up. Recorder is rotated until the green light illuminates.<br />
When green light is on, <strong>com</strong>munication can be established with the<br />
software. For best connection conditions, recorder is placed in the middle<br />
of the area where the green light is on.<br />
For our latest products we have added a mark on both the housing and<br />
the Communication Box to help finding the right position. Simply turn the<br />
logger until the small grey mark on top of the sensor meets the marking<br />
that is drilled into the surface of the Communication Box.<br />
If the recorder fails to connect, please refer to the Troubleshooter.<br />
Some recorders have marking, a dot or a line, on the flat end. This<br />
marking matched against a similar marking on the Communication Box will<br />
give the best position for <strong>com</strong>munication.<br />
@Star-Oddi 2010. All Rights Reserved
<strong>User</strong> <strong>Manual</strong><br />
<strong>Mercury</strong> Graphic Supporting <strong>Software</strong><br />
Extra Ground Connection<br />
The black connector in the back of the new Communication Box is a<br />
ground connector that can be used to ground the box, with the black wire<br />
with the alligator clip that is included. Normally, this should not be<br />
necessary. Extra ground wire could be needed if the there is a lot of<br />
electromagnetic noise (like powerful electronic equipment on board<br />
vessels), when the Communication Box is being used. If you need to use<br />
the wire you plug it in the Com Box and clip the other end to anything that<br />
has ground connection (on a vessel e.g. the iron hull of the boat is always<br />
grounded).<br />
4.3 COM Connection<br />
Figure 4.2 Communication Definition<br />
Choose Settings-Communication-Serial Ports to display available ports<br />
(see figure 4.2). Com ports up to COM255 can be selected.<br />
@Star-Oddi 2010. All Rights Reserved
<strong>User</strong> <strong>Manual</strong><br />
<strong>Mercury</strong> Graphic Supporting <strong>Software</strong><br />
4.4 Com Port Wizard<br />
Figure 4.3 Com Port Wizard<br />
Choose Wizards-Com Port to enter the Com Port wizard (see figure<br />
4.3). The wizard goes through available ports and activates them one at a<br />
time and asks the user to confirm that the <strong>com</strong>munication box displays a<br />
yellow light.<br />
@Star-Oddi 2010. All Rights Reserved
<strong>User</strong> <strong>Manual</strong><br />
<strong>Mercury</strong> Graphic Supporting <strong>Software</strong><br />
5.Using DST - Tutorial<br />
This chapter guides users in 8 quick steps through the process of utilizing<br />
<strong>Mercury</strong> to set up DST prior to recording and data retrieval.<br />
5.1 <strong>Mercury</strong> Set Up<br />
Step 1 - Start Program<br />
Start <strong>Mercury</strong> as described in chapter 2. Remember to carry out the<br />
software preparation outlined in chapter 3.<br />
Step 2 - Connect<br />
Connect the Communication Box as described in chapter 4. Insert DST<br />
into the hole in the box, and twist the recorder until the green light<br />
illuminates on the box.<br />
Step 3 - Connect to the Recorder<br />
Choose the Recorder menu and the Connect <strong>com</strong>mand. The window in<br />
figure 5.1 appears.<br />
Figure 5.1 Connecting and Retrieving<br />
@Star-Oddi 2010. All Rights Reserved
<strong>User</strong> <strong>Manual</strong><br />
<strong>Mercury</strong> Graphic Supporting <strong>Software</strong><br />
Once the connection has been established, a window appears with<br />
information on the recorder’s mode (see figure 5.2).<br />
Figure 5.2 Connecting to the Recorder<br />
Press OK. The Recorder is now on-line, as indicated at the bottom of the<br />
<strong>Mercury</strong> window.<br />
Connection Time Registration<br />
Each time <strong>Mercury</strong> connects to a Recorder, the PC time and recorder<br />
time is registered to a binary file, with a CLK extension. This information is<br />
also saved to a text file with the extension CCT.<br />
Another text file is created with the extension CCD, containing various<br />
information, for example on previous connection and time <strong>com</strong>parisons,<br />
depending on the status of recorder.<br />
If a previous CCT file exists and the recorder was in sleep or slumber<br />
mode, a PC vs. recorder clock <strong>com</strong>parison is calculated, indicating<br />
difference in seconds and ppm.<br />
If the recorder was in measurement mode, then a drift calculation is<br />
performed, based upon PC-time <strong>com</strong>parison to the recorder’s clock and<br />
measurement sequence.<br />
The RIT file contains partly the same information as the CCD file.<br />
Upon retrieving date from a recorder and converting the data, the last<br />
measurement retrieved time and the next scheduled measurement time is<br />
<strong>com</strong>pared to the PC time. The results are added to the CCD file and the<br />
MIT file.<br />
Note: If the retrieved number of data does not match the last measured<br />
number of data, erroneous results are to be expected.<br />
Step 4 - Set new Measurement Parameters<br />
(If the recorder has already been set up to record data and you want to<br />
retrieve data, go directly to step 6).<br />
Choose the Edit menu and the New Measurement Sequence Definition<br />
<strong>com</strong>mand. The following window appears:<br />
@Star-Oddi 2010. All Rights Reserved
<strong>User</strong> <strong>Manual</strong><br />
<strong>Mercury</strong> Graphic Supporting <strong>Software</strong><br />
Figure 5.3 Measurement Sequence Definition<br />
Select the start time of recordings (date-month-year, hours-minutes).<br />
Set the sampling interval (hours-minutes-seconds).<br />
If the user wants to program several recorders with the same sampling<br />
interval and start time, it is re<strong>com</strong>mended to select Multi mode. By<br />
choosing Multi mode, the settings are fixed; giving each recorder<br />
connected to thereafter, the same settings. The recorders connected to,<br />
following the first recorder; automatically get the same settings as the first<br />
recorder. This saves time in the programming process. After the settings<br />
have been selected, press the OK button. For programming more than<br />
one sampling interval, please refer to chapter 9 Multiple Intervals.<br />
If the user wants to program several recorders with the same sampling<br />
interval and start time, it is re<strong>com</strong>mended to select Multi mode. By<br />
choosing Multi mode, the settings are fixed; giving each recorder<br />
connected to thereafter, the same settings. The recorders connected to,<br />
following the first recorder; automatically get the same settings as the first<br />
recorder. This saves time in the programming process. After the settings<br />
@Star-Oddi 2010. All Rights Reserved
<strong>User</strong> <strong>Manual</strong><br />
<strong>Mercury</strong> Graphic Supporting <strong>Software</strong><br />
have been selected, press the OK button. For programming more than<br />
one sampling interval, please refer to chapter 9 Multiple Intervals.<br />
The three buttons Use Template, Use Sequence, and Previous are not<br />
<strong>com</strong>monly used, but can be handy when wanting to use a previously<br />
programmed sequence. To read more about templates see chapter 8.<br />
Step 5 - Start a new Measurement Sequence<br />
To set the recorder in Measurement Mode (start recording), choose the<br />
Recorder menu and Start New Measurement Sequence <strong>com</strong>mand. The<br />
window in figure 5.4 appears.<br />
Figure 5.4 Start New Measurement Sequence<br />
Once the new measurement sequence has been downloaded into the<br />
recorder, a window appears on the screen in order to verify the settings<br />
(see figure 5.5).<br />
@Star-Oddi 2010. All Rights Reserved
<strong>User</strong> <strong>Manual</strong><br />
<strong>Mercury</strong> Graphic Supporting <strong>Software</strong><br />
Figure 5.5 Start New Measurement Sequence<br />
Press OK and the recorder will be in Measurement Mode.<br />
NMS Calculation<br />
Upon setting up a NMS the estimated measurement sequence is<br />
calculated and memory and battery energy usage predicted. The results<br />
are written to a text file, bearing the recorder name with a NMS extension.<br />
If a recorder has not been selected then the file bears the recorder type<br />
name, still the NMS extension.<br />
The file is placed in the <strong>Mercury</strong>\NMS directory.<br />
An example of the *.NMS file is shown in fig. 5.6.<br />
Figure 5.6 Results from NMS Calculation<br />
@Star-Oddi 2010. All Rights Reserved
<strong>User</strong> <strong>Manual</strong><br />
<strong>Mercury</strong> Graphic Supporting <strong>Software</strong><br />
When starting the recorder in a NMS, the *.RDT file shows the sequence<br />
settings, plus information on the sequence time duration and battery<br />
usage (same as in the *NMS file).<br />
Step 6 - Retrieve Data<br />
Choose the Recorder menu and the Retrieve Data <strong>com</strong>mand. The<br />
window in figure 5.7 appears.<br />
Figure 5.7 Retrieve Data from Recorder<br />
The window in figure 5.7 shows the data retrieval progress in bytes, time<br />
elapsed and number of packs received.<br />
Data will be uploaded from the recorder and presented in graphical and<br />
tabular form. With default settings, <strong>Mercury</strong> automatically creates a subdirectory<br />
in the <strong>Mercury</strong> directory, named after the DST type. In the DST<br />
type directory, a directory named after the recorder’s serial number Unnnn<br />
is created; U is the letter for DST micro. All files related to the recorder<br />
are automatically saved in the serial number directory. The default data<br />
@Star-Oddi 2010. All Rights Reserved
<strong>User</strong> <strong>Manual</strong><br />
<strong>Mercury</strong> Graphic Supporting <strong>Software</strong><br />
directory can be viewed in the Settings menu, and Directories. The user<br />
has the option to define a new data directory path if desired.<br />
The data is retrieved in a non-destructive manner. This means that you<br />
can repeatedly read the data without erasing it from the memory. Each<br />
time data is retrieved, a new file will automatically be created. The name of<br />
the data file consists of the measurement sequence number and the serial<br />
number of the recorder. The recorder cannot be loaded with new settings<br />
if it contains data that has not been retrieved. This is a safety feature<br />
which prevents data from being accidentally lost. New recordings<br />
overwrite previous recordings that have been retrieved.<br />
Step 7 - Disconnect<br />
After the recorder has been set up for measuring, it should be removed<br />
from the Communication Box. If the recorder is not put in measurement<br />
mode, it will automatically go into sleep mode when removed from the<br />
box.<br />
If you simply remove the tag <strong>Mercury</strong> will still have the recorder in on-line<br />
mode in the program and won’t allow selecting another recorder or using<br />
certain options. Select Recorder > Disconnect to go into off-line mode.<br />
Step 8 - View Data<br />
If data is retrieved from the recorder, a new file will automatically be<br />
created and opened in graphical and tabular form. To open existing data<br />
files on the <strong>com</strong>puter, choose the File menu, Select Recorder <strong>com</strong>mand,<br />
and then the Select Measurement <strong>com</strong>mand. When a data file has been<br />
opened, a new window appears with the data shown as a chart and a<br />
table. The next chapter will describe in detail how to view and process<br />
data.<br />
@Star-Oddi 2010. All Rights Reserved
<strong>User</strong> <strong>Manual</strong><br />
<strong>Mercury</strong> Graphic Supporting <strong>Software</strong><br />
@Star-Oddi 2010. All Rights Reserved
<strong>User</strong> <strong>Manual</strong><br />
<strong>Mercury</strong> Graphic Supporting <strong>Software</strong><br />
6.View Data<br />
This chapter describes how to open a data file and the options available<br />
in <strong>Mercury</strong> for viewing the data.<br />
6.1 Open Data<br />
To open an existing data file that has already been retrieved, do the<br />
following:<br />
1. Choose the File menu and the Select Recorder <strong>com</strong>mand. When<br />
a recorder has been selected, its serial number will be displayed in<br />
the blue top bar of the software.<br />
2. Select the data file by choosing the File menu and the Select<br />
Measurement <strong>com</strong>mand.<br />
The name of the data file consists of the measurement sequence number<br />
(number of times the recorder has been set up to measure) plus the serial<br />
number of the recorder. The ‘Measurement sequence no.’ can also be<br />
seen at the bottom in the <strong>Mercury</strong> window. When the data file (.mid) has<br />
been selected, the chart and data tables are opened. The following figure<br />
shows a chart and data table which have been opened:<br />
Figure 6.1 Chart and Data Tables of an open File<br />
@Star-Oddi 2010. All Rights Reserved
<strong>User</strong> <strong>Manual</strong><br />
<strong>Mercury</strong> Graphic Supporting <strong>Software</strong><br />
6.2 Import<br />
Data files from other recorders than DST can be imported into <strong>Mercury</strong><br />
and viewed as charts and tables. The imported file must be a text file with<br />
the extension DAT, and with <strong>Mercury</strong>’s conventional DAT file structure.<br />
See more about data files and headers in the Appendix.<br />
6.3 Buttons<br />
When the chart is opened, buttons related to the chart are displayed.<br />
Active Series List<br />
This button can be useful when working with a multi-sensor recorder, in<br />
order to select which parameters to display in the chart. For example,<br />
when working with a chart displaying temperature recordings, the user<br />
can hide the temperature line in the graph.<br />
Horizontal/Vertical Gridlines<br />
These two buttons give the option of hiding/displaying the<br />
horizontal/vertical gridlines in the chart.<br />
Data Point Marker<br />
This button gives the option of displaying/hiding data points in the chart.<br />
Histogram<br />
The chart can be shown as histogram, displaying the distribution of values<br />
by percentage.<br />
@Star-Oddi 2010. All Rights Reserved
<strong>User</strong> <strong>Manual</strong><br />
<strong>Mercury</strong> Graphic Supporting <strong>Software</strong><br />
Click the histogram button and the following window appears:<br />
Figure 6.2 Histogram<br />
Under Bin Settings there are two options, Default and <strong>User</strong>. Choose<br />
<strong>User</strong> to select the number of bins and the minimum and maximum values<br />
you wish to display.<br />
The Histogram can be printed out by clicking the Print button.<br />
Save Window Data<br />
Retrieved data is automatically saved, but if changes are made with the<br />
graph, for example with the time scale, the save button enables the user<br />
to save the graph (as a DAT file).<br />
Print Chart<br />
The chart can be printed. Please see chapter 7 for more details.<br />
@Star-Oddi 2010. All Rights Reserved
<strong>User</strong> <strong>Manual</strong><br />
<strong>Mercury</strong> Graphic Supporting <strong>Software</strong><br />
Zoom Out<br />
Click this button to zoom out the chart.<br />
Adjust Axis<br />
This button adjusts the axis in order to display all data within the zoomed<br />
timeline.<br />
Transfer data to PatternFinder<br />
Click this button to transfer data to PatternFinder<br />
Chart Edit<br />
By clicking this button, the following window appears:<br />
@Star-Oddi 2010. All Rights Reserved
<strong>User</strong> <strong>Manual</strong><br />
<strong>Mercury</strong> Graphic Supporting <strong>Software</strong><br />
Figure 6.3 Editing Chart<br />
This button gives several options regarding the look of the graph. The axis<br />
can be defined (max. and min.), titles and legend can be set visible. Under<br />
‘Panel’ the color of background, borders and gradient can be selected.<br />
Under ‘Walls - Back’ the colors and gradient of the graph itself can be<br />
selected. The ‘Visible’ option must be enabled to activate the features.<br />
The graph can be exported in formats as jpg, gif, bitmap, metafile, pdf,<br />
htm and svg.<br />
Templates<br />
If the changes have been made to the graph under ‘Chart Edit’, it is<br />
possible to save that template. It is also possible to load a previously<br />
saved template (i.e background).<br />
@Star-Oddi 2010. All Rights Reserved
<strong>User</strong> <strong>Manual</strong><br />
<strong>Mercury</strong> Graphic Supporting <strong>Software</strong><br />
Hide/Show Table<br />
The data table can be either displayed or hidden using this option.<br />
6.4 Using the Mouse<br />
Max and Min Values<br />
Click once on any line in the chart, and the maximum and minimum values<br />
for that line (sensor) are now shown. A straight vertical line should be<br />
visible in the graph (to the left). By clicking on this line and holding the left<br />
button on your mouse down, the line can be dragged through the chart<br />
and the data table will scroll along with the position of the line.<br />
Zoom<br />
The chart can be zoomed in on by holding down the left button of the<br />
mouse, and using the cursor to create a box to the right, around the<br />
desired area to zoom in on.<br />
Scroll the Chart<br />
The chart can be scrolled upward, downwards and to the sides, by<br />
holding down the right button of the mouse and moving the cursor in the<br />
desired direction.<br />
Go back to initial View<br />
To go back to the initial view of the chart, simply hold down the left button<br />
of the mouse and make a box to the left with the cursor. The position of<br />
the box on the chart is irrelevant.<br />
Change the Axis<br />
By double clicking on the X and Y-axis, the measurement time and<br />
temperature range can be changed.<br />
Change the Title<br />
To change the title of the chart, double click on the title of the chart<br />
@Star-Oddi 2010. All Rights Reserved
<strong>User</strong> <strong>Manual</strong><br />
<strong>Mercury</strong> Graphic Supporting <strong>Software</strong><br />
6.5 The View Menu<br />
When a recorder has been selected, the files in the View menu can be<br />
opened.<br />
Data Trend and Table<br />
This view is automatically selected when data is retrieved or a data file is<br />
opened. If the chart is closed, but a recorder has been selected, this<br />
<strong>com</strong>mand can be selected to view the chart. The software will open the<br />
latest chart that was viewed for that recorder.<br />
Recorder Information (RIT)<br />
This is a text file containing basic information about the recorder, serial<br />
number, production date, estimated battery life etc.<br />
Recorder Calibration Information (RCI)<br />
This text file contains information about the calibration constants of the<br />
recorder, calibration range of the parameters. The range is both showed<br />
as decimal values (DV) and unit values (UV).<br />
Recorder Download Information (RDT)<br />
This text file contains information about the measurement sequence that<br />
was last downloaded into the recorder, including the start time, sampling<br />
interval and the measurement sequence number.<br />
Viewing Text Files<br />
Under the user can select a text file, via a file browser,<br />
for viewing.<br />
This option is meant to give the (advanced) user a chance to view files<br />
that are not directly supported for viewing in <strong>Mercury</strong>, but are a part of the<br />
<strong>Mercury</strong> documentation system.<br />
The files that the file browser accepts must have the following extensions:<br />
<br />
TXT<br />
Frequently, users copy <strong>Mercury</strong> data to text processors and<br />
spreadsheets, like Word and Excel, and later save the data as TXT<br />
files for viewing in other applications.<br />
@Star-Oddi 2010. All Rights Reserved
<strong>User</strong> <strong>Manual</strong><br />
<strong>Mercury</strong> Graphic Supporting <strong>Software</strong><br />
<br />
<br />
<br />
<br />
<br />
INI<br />
There are a number of INI files that <strong>Mercury</strong> uses for store settings.<br />
These files are described in the Appendix under ‘Information files’.<br />
The latest members in the INI files family are the Template files.<br />
DAD<br />
This is the original data file. It contains the raw data (in Ascii format)<br />
retrieved from recorder. The DAD together with the MID are<br />
converted to the DAT file.<br />
A word of warning: The DAD file should never be tempered with, as<br />
that might give cause to erroneous data conversion.<br />
CCT<br />
Every time <strong>Mercury</strong> connects to a recorder, the PC time and the<br />
recorder’s clock data are stored in a .CCT file.<br />
CCD<br />
Every time <strong>Mercury</strong> connects to a recorder, the PC time and the<br />
recorder’s time are <strong>com</strong>pared to the last CCT, if found, and stored<br />
in .CCD file, .CCD.<br />
NMS<br />
Upon <strong>com</strong>pletion of a NMS editing session, estimation of memory<br />
and battery usage is calculated and the results placed in a NMS<br />
file, which is then displayed to the user.<br />
SNMS LOG File<br />
To improve the “Start New Measurement Sequence”, SNMS,<br />
indication/registration of success or failure, a log file for each recorder<br />
type is placed in the <strong>Mercury</strong> directory.<br />
The log file name, for DST micro, is DSTU.LOG, i.e. the same naming<br />
convention as for the type INI files.<br />
Each time a SNMS is performed then the appropriate LOG file is<br />
updated.<br />
The LOG file can be viewed via “View\SNMS Log file (LOG)” (see figure<br />
6.5).<br />
In addition to the LOG file, if an error occurs during the SNMS, the MDD<br />
file is created as a text file, with a description of what went wrong. This<br />
MDD file is displayed as a clear message for the user:<br />
@Star-Oddi 2010. All Rights Reserved
<strong>User</strong> <strong>Manual</strong><br />
<strong>Mercury</strong> Graphic Supporting <strong>Software</strong><br />
Figure 6.4 The MDD SMNS Error Message<br />
Usually the MDD file is a binary file, and the MDT is created from the<br />
MDD. If the SNMS is repeated successfully the MDD file is overwritten<br />
and the MDT file created (figure 6.5).<br />
Figure 6.5 Example of a LOG File<br />
@Star-Oddi 2010. All Rights Reserved
<strong>User</strong> <strong>Manual</strong><br />
<strong>Mercury</strong> Graphic Supporting <strong>Software</strong><br />
Measurement Data<br />
Measurement Download Definition (MDT)<br />
This text file contains information on data downloaded into the recorder<br />
for the measurement file being viewed, including the start time and<br />
sampling interval.<br />
Measurement Information (MIT)<br />
This text file contains information concerning the measurement upload<br />
time, start date, start time and number of measurements in the<br />
measurement data file.<br />
Conversion Information (CIT)<br />
This text file contains conversion information on the units and the data file<br />
format.<br />
Statistics in CIT:<br />
The CIT has been enhanced with more detailed information on the<br />
converted data.<br />
As can been seen in figure 6.6, the statistical data, that have been<br />
tabulated, are split into two sections, the Unit values statistics and the<br />
Decimal value statistics. Values are given for each parameter. The file can<br />
be viewed under ‘View\Measurement Data\Conversion Information (CIT)’:<br />
Figure 6.6 Statistics in CIT File<br />
@Star-Oddi 2010. All Rights Reserved
<strong>User</strong> <strong>Manual</strong><br />
<strong>Mercury</strong> Graphic Supporting <strong>Software</strong><br />
A one line description/<strong>com</strong>ment is available for the user to fill out in the<br />
Reconvert data menu. This description is placed in line two of the CIT file.<br />
Out of Range (OOR)<br />
This text file lists all the measurements that were outside decimal value<br />
calibration range, as well as the unit value range. If correction has been<br />
performed according to the user definition, then the corrected values are<br />
show. See more about ‘out of range’ in chapter 8.<br />
Binary Data (DAB)<br />
This file contains raw data of the measurements in the data file.<br />
Calibration files are not calculated into the data.<br />
View DAB Files as Trend<br />
When converting the DAD -> DAT the DAB file is created simultaneously.<br />
The DAB shows the recorder’s native data, i.e. decimal values in the<br />
range 0-4095. These values originate from the recorders 12 bit ADC<br />
(Analog to Digital Converter).<br />
It can be of interest to view the data in its native form, for example to spot<br />
saturation/out of range intervals.<br />
A new header has been designed for the DAB and Date and Time<br />
columns have been added to the DAB file. Thus the DAB can now be<br />
viewed graphically as a trend via:<br />
‘View\Data Trend and Table\Decimal (Binary) data (DAB)’<br />
@Star-Oddi 2010. All Rights Reserved
<strong>User</strong> <strong>Manual</strong><br />
<strong>Mercury</strong> Graphic Supporting <strong>Software</strong><br />
Figure 6.7 DAB Trended<br />
<strong>Mercury</strong> cannot view older DAB files, and will inform the user to that<br />
effect, if an attempt to view an older DAB file is performed. By<br />
reconverting the data, a viewable file is produced.<br />
Converted Data (DAT)<br />
This is the text file for the converted data. The DAT file as well as the<br />
other text files can be opened in other programs (Excel, Notepad, Word<br />
etc.).<br />
Time Synchronic Data (TSD) and Rate of Change (ROC)<br />
If the TSD and/or ROC file creation has been enabled under the Settings<br />
menu, then it’s possible to view these files.<br />
You can find more in chapter 8.7 TSD and chapter 8.8 ROC and more<br />
about files in the Appendix.<br />
@Star-Oddi 2010. All Rights Reserved
<strong>User</strong> <strong>Manual</strong><br />
<strong>Mercury</strong> Graphic Supporting <strong>Software</strong><br />
<strong>Mercury</strong> Log<br />
<strong>Mercury</strong> stores events in the file . The events are:<br />
Recorder Connected<br />
Retrieving data from a recorder<br />
Uploading a measurement sequence to a recorder<br />
Recorder disconnected.<br />
This file can be opened in <strong>Mercury</strong> under or by<br />
opening it with a text editor.<br />
6.6 Opening Data in Excel<br />
The <strong>Mercury</strong> software automatically creates a text file with the data, called<br />
*.DAT, when retrieving data. This text file can be opened in Excel and in<br />
other programs.<br />
Under the ‘Settings’ menu, ‘Preferences – Data File Format’, the default<br />
factory settings is set to ‘joined date and time’. If this option is not<br />
disabled, the following is performed, for opening data in Excel:<br />
1. Excel is started.<br />
2. The *.dat file is found from ‘File/Open’.<br />
3. Excel <strong>com</strong>es up with the ‘Text import wizard’. This is a three step<br />
process:<br />
a. No changes should be made in first step, so press the next<br />
button.<br />
b. ‘Text qualifier’ should be set as ‘None’.Press the next button.<br />
c. Column 2, that is date and time, is set as ‘Text’. Press the<br />
finish button.<br />
4. You can now create the graph with columns B, C and D.<br />
@Star-Oddi 2010. All Rights Reserved
<strong>User</strong> <strong>Manual</strong><br />
<strong>Mercury</strong> Graphic Supporting <strong>Software</strong><br />
@Star-Oddi 2010. All Rights Reserved
<strong>User</strong> <strong>Manual</strong><br />
<strong>Mercury</strong> Graphic Supporting <strong>Software</strong><br />
7.Printing<br />
All charts and text files can be printed from the <strong>Mercury</strong> software.<br />
7.1 Charts<br />
Open the chart you want to print out and select File-Print on the menu<br />
bar. The following window appears:<br />
Orientation<br />
Figure 7.1 Print Preview<br />
The chart can be printed in either portrait or landscape format.<br />
Margins<br />
By changing the margins, the chart’s length and width can be re-scaled.<br />
The margins can be varied by either changing the numbers given for the<br />
left, right, top and bottom margins, or by moving the margin lines with the<br />
mouse by pressing and holding the left button as the lines are dragged.<br />
@Star-Oddi 2010. All Rights Reserved
<strong>User</strong> <strong>Manual</strong><br />
<strong>Mercury</strong> Graphic Supporting <strong>Software</strong><br />
Move<br />
When the cursor is located on the chart, a hand be<strong>com</strong>es visible. By<br />
clicking on the graph and holding down the left button of the mouse, the<br />
graph can be moved around the page to a desired position.<br />
Details<br />
The size of horizontal and vertical gridlines as well as the texts on the X<br />
and Y-axis can be re-scaled by using the scroll bar. The number of<br />
gridlines is increased when the bar is moved to the left.<br />
Another way of printing out a chart is opening the chart you want to print<br />
out and clicking the Print Chart button on the chart bar.<br />
7.2 Histogram<br />
To print out a histogram, open the chart which histogram you want to print<br />
out and click on the Histogram button on the chart bar. The following<br />
window appears:<br />
Figure 7.2 Histogram<br />
Click Print and the window in figure 7.3 appears:<br />
@Star-Oddi 2010. All Rights Reserved
<strong>User</strong> <strong>Manual</strong><br />
<strong>Mercury</strong> Graphic Supporting <strong>Software</strong><br />
Figure 7.3 Output Options<br />
To change the selected printer, click Setup and select another printer.<br />
To see a preview of the print out, select Preview under Report<br />
Destination and click OK (see figure 7.3 and 7.4).<br />
Figure 7.4 Report Preview<br />
@Star-Oddi 2010. All Rights Reserved
<strong>User</strong> <strong>Manual</strong><br />
<strong>Mercury</strong> Graphic Supporting <strong>Software</strong><br />
7.3 Files<br />
Activate the file you want to print out and select File-Print. The following<br />
window appears:<br />
Figure 7.5 Output Options<br />
The dialog window in figure 7.5 has the same functions as the one in<br />
figure 7.3.<br />
Note that as some of the files are very large, it is re<strong>com</strong>mended to<br />
highlight the data you want to print out before printing.<br />
Figure 7.6 Report Preview<br />
@Star-Oddi 2010. All Rights Reserved
<strong>User</strong> <strong>Manual</strong><br />
<strong>Mercury</strong> Graphic Supporting <strong>Software</strong><br />
8.Settings<br />
This chapter describes the options in the Settings menu. These settings<br />
are automatically saved when exiting the program.<br />
8.1 Directories<br />
The path definition can be set as Default <strong>Mercury</strong> path structure or <strong>User</strong><br />
defined paths. Choose the Settings menu and the Directories<br />
<strong>com</strong>mand. A dialog box appears:<br />
Figure 8.1 Directory Path Definitions<br />
Default <strong>Mercury</strong> Path Structure<br />
By choosing a DST recorder type, <strong>Mercury</strong> automatically creates a DST<br />
type directory in the ‘<strong>Mercury</strong>’ directory that was created when the<br />
software was installed on the <strong>com</strong>puter. Upon connection with DST,<br />
another directory is automatically created under the type directory, which<br />
is named after the serial number of the recorder. All data files and other<br />
files related to that recorder are stored in this ‘serial number’ directory.<br />
Each DST recorder has its own data directory.<br />
@Star-Oddi 2010. All Rights Reserved
<strong>User</strong> <strong>Manual</strong><br />
<strong>Mercury</strong> Graphic Supporting <strong>Software</strong><br />
<strong>User</strong> Defined Paths<br />
If this option is selected, the <strong>User</strong> definition data directory be<strong>com</strong>es<br />
active. The data path/directory can be defined by the user. For defining a<br />
path on the network, the particular drive must be mapped (under<br />
Windows Explorer) in order to browse for the drive under ‘Add data path’.<br />
Browse first in <strong>User</strong> Directory<br />
With default off, the user is first directed to the path where <strong>Mercury</strong> was<br />
installed, to look for the INI file. If this option is enabled, <strong>Mercury</strong> will start<br />
looking for the INI file in the user-defined directory. More information on<br />
files and directories can be found in the Appendix.<br />
Create Recorder Directories<br />
This option is default on, and means that a recorder type and serial<br />
number directory is created for every recorder connected to.<br />
Units<br />
8.2 Preferences<br />
By choosing the Settings menu, the Preferences <strong>com</strong>mand, and Units, a<br />
dialog box appears:<br />
Figure 8.2 Unit Dialog Box<br />
@Star-Oddi 2010. All Rights Reserved
<strong>User</strong> <strong>Manual</strong><br />
<strong>Mercury</strong> Graphic Supporting <strong>Software</strong><br />
Selecting Units<br />
The user defines whether degrees Celsius or Fahrenheit are used as a<br />
unit for temperature measurements and Bar or psi for pressure<br />
recordings. Number of decimals for the values can be selected.<br />
Data File Format<br />
By choosing the Settings menu, the Preferences <strong>com</strong>mand, and Data<br />
File Format, a dialog box appears:<br />
Figure 8.3 Data File Format Dialog Box<br />
Date Format<br />
The user defines whether the date should be shown as dd mm yy (day,<br />
month, year), or mm dd yy (month, day, year).<br />
Date Separation<br />
The user defines whether a dot, slash or dash should be used to separate<br />
the date.<br />
@Star-Oddi 2010. All Rights Reserved
<strong>User</strong> <strong>Manual</strong><br />
<strong>Mercury</strong> Graphic Supporting <strong>Software</strong><br />
Time Separation<br />
The user defines whether a colon or a dot should be used for the time<br />
separation.<br />
Field Separation<br />
For the text files created, the user defines whether a tab or a space<br />
should be used to separate the fields.<br />
Date and Time Column Definition<br />
If data is to be exported to other programs, it is re<strong>com</strong>mended that the<br />
date and time be joined in one column.<br />
Select Decimal Point<br />
The user defines whether a <strong>com</strong>ma or period is used for the values<br />
displayed in <strong>Mercury</strong> and for text files that are created.<br />
Measurement Interval<br />
The default setting in the software is set to ‘Single interval’, as most users<br />
utilize. By choosing ‘Multiple intervals’ the software enables programming<br />
of several different sampling intervals, enabling memory saving efficiency.<br />
By choosing the Settings menu, the Preferences <strong>com</strong>mand, and then<br />
Sampling Intervals, the following dialog box appears:<br />
Figure 8.4 Measurement Intervals<br />
By choosing ‘Multiple intervals’ the effects are shown in the dialog box<br />
that appears when you choose the New Measurement Sequence<br />
Definition <strong>com</strong>mand under the Edit menu. More details about multiple<br />
intervals in chapter 9.<br />
@Star-Oddi 2010. All Rights Reserved
<strong>User</strong> <strong>Manual</strong><br />
<strong>Mercury</strong> Graphic Supporting <strong>Software</strong><br />
8.3 Connection<br />
Choose the Settings menu and the Connection <strong>com</strong>mand. A dialog box<br />
appears:<br />
Figure 8.5 Connect and retrieve Data Options<br />
Perform CRC Test when Retrieving RID<br />
The CRC test is a safety check performed by the software when<br />
retrieving Recorder Information Data (RID). If the CRC test is not<br />
successfully carried out, it means that some errors have occurred in the<br />
transfer of files or constants, between the recorder and the <strong>com</strong>puter. If a<br />
CRC test failure occurs, the user is notified. Normally, this option should<br />
always be selected.<br />
Check Data Echo in SNMS<br />
Normally the Check Data Echo in SNMS and updating settings in<br />
Disconnect and Retrieve Data should be enabled (figure 8.5). In case of<br />
<strong>com</strong>munication problems using a USB serial converter the user can try to<br />
disable this option, as it will bypass data echo checks, resulting in less<br />
restriction on <strong>com</strong>munication protocol.<br />
Automatic Data Retrieval upon Connection<br />
By enabling this option, the software will automatically check for data in<br />
the recorder upon connection. If this option is not enabled, data retrieval<br />
is done manually by choosing the ‘File’ menu, and ‘Retrieve Data’<br />
<strong>com</strong>mand.<br />
@Star-Oddi 2010. All Rights Reserved
<strong>User</strong> <strong>Manual</strong><br />
<strong>Mercury</strong> Graphic Supporting <strong>Software</strong><br />
8.4 Retrieve Data<br />
Choose the Settings menu and the Retrieve Data <strong>com</strong>mand. A dialog<br />
box appears:<br />
Retrieve Number of Data<br />
Figure 8.6 Retrieve Data Options<br />
With default settings, the software retrieves the last measurement<br />
sequence recorded. The user has the option of retrieving older data that<br />
is still in the recorder’s memory. By choosing the <strong>User</strong> defined number<br />
of data, the number of measurements retrieved from the recorder can be<br />
set. When retrieving data, it is optional to view the Data Trend after<br />
conversion.<br />
As the <strong>com</strong>plexity of measurement intervals give incoherence in the<br />
calculation from measurement number to the number of data byte to<br />
retrieve, the user has the option to define number of bytes to retrieve. Also<br />
when not online working with measurement data, it is optional to view the<br />
Data Trend after a Sequence Selection.<br />
If for some reason or another it be<strong>com</strong>es necessary to retrieve data more<br />
than once or even several times, the previous DAD and MIT files are not<br />
@Star-Oddi 2010. All Rights Reserved
<strong>User</strong> <strong>Manual</strong><br />
<strong>Mercury</strong> Graphic Supporting <strong>Software</strong><br />
overwritten before a backup has been made. The backup files are in the<br />
same directory as the “original” or the last DAD file.<br />
A backup number system is in use that marks the first retrieved file as<br />
number one, the second number two etc. The number sign #, is used to<br />
identify the backup up files.<br />
Thus if a data file has for example the name 25M1106.DAD then the<br />
backup file, that was the first retrieval, gets the name 1#25M1106.DAD,<br />
and the 25M1106.MIT file that is associated with the DAD file, is backed<br />
up as 1#25M1106.MIT.<br />
8.5 Re-Conversion<br />
Choose the Settings menu and the Re-Conversion <strong>com</strong>mand. A dialog<br />
box appears:<br />
Figure 8.7 Reconvert Menu<br />
With all the options in <strong>Mercury</strong>, the user may want to do a lot of<br />
reconverting () on data files after defining the<br />
preferences; changing units, data formats, OOR settings, TSD settings,<br />
ROC settings, offset settings and converting different sections of the data<br />
file, all of which result in numerous files. To ease the task of remembering<br />
settings and results and/or renaming and copying files, a backup system<br />
of reconverted files has been implemented.<br />
@Star-Oddi 2010. All Rights Reserved
<strong>User</strong> <strong>Manual</strong><br />
<strong>Mercury</strong> Graphic Supporting <strong>Software</strong><br />
A reconvert number is now associated with each sequence. This number<br />
is saved in the recorder’s INI file and updated each time a reconvert is<br />
implemented. A copy is made of the DAT, CIT, DAB, OOR, TSD and the<br />
ROC files with the reconvert number attached to the filename.<br />
Thus if a data file is for example named 5M1024.DAT, i.e. sequence 5 for<br />
DST milli 1024, then after the first reconvert, a copy of the DAT is named<br />
1-5M1024.DAT and the same naming convention is applied to the other<br />
files.<br />
Each time data retrieval is performed, a subdirectory, which name is the<br />
sequence number, is created in the data directory, where a copy of the<br />
“original” DAT, DAB,CIT and OOR files is placed. These files have a “0-“<br />
in their names. All the reconverted files are placed in the sequence<br />
directory. The reconvert number system is optional, and the user can<br />
disable it in the reconvert menu. When the reconvert number system is in<br />
use, and when viewing trended reconverted data, the reconverted<br />
“backup” file is displayed, thus eliminating the need to close the “last”<br />
converted trend data window.<br />
8.6 Out Of Range<br />
If measurements are outside the calibrated range, they may seem<br />
inaccurate. The out of range measurements are shown in the OOR file<br />
(View – Measurement Data – Out Of Range Data). The min and max<br />
calibration points are given in the RID file, and in this case it should be<br />
sufficient to go directly to ‘Edit – Reconvert Definition – Data Definition’,<br />
and choose ‘RID values’ under ‘Out of range decimal values settings’.<br />
Data is then reconverted by choosing ‘File – Reconvert Data’. You can<br />
find more about reconverting in chapter 10.<br />
The user can also define the ranges. Choose the Settings menu, Out Of<br />
Range - UV and DV definition <strong>com</strong>mand. A dialog box appears:<br />
@Star-Oddi 2010. All Rights Reserved
<strong>User</strong> <strong>Manual</strong><br />
<strong>Mercury</strong> Graphic Supporting <strong>Software</strong><br />
Decimal Values<br />
Figure 8.8 Set TD Out Of Range (OOR) Parameters<br />
Decimal Values (DV) are raw measurements, sometimes referred to as<br />
binary data. The decimal value is between 0 and 4095, which is the range<br />
for the 12 bit AD converter. The decimal values are the recorder’s<br />
calibration range. The user should not define the decimal value range,<br />
unless he has obtained these values for that particular recorder from Star-<br />
Oddi.<br />
Unit Values<br />
The decimal values are converted to Unit Values (UV), for example a<br />
decimal value of 2000 could give 20°C. The user can select a specified<br />
range for the temperature. If unit values in the data are outside the<br />
measurement calibration range of the recorder, the user has the option to<br />
set a max. and min. range for these unit values. After selecting the unit<br />
value ranges and pressing the OK button, the following window appears:<br />
@Star-Oddi 2010. All Rights Reserved
<strong>User</strong> <strong>Manual</strong><br />
<strong>Mercury</strong> Graphic Supporting <strong>Software</strong><br />
Figure 8.9 Out Of Range (OOR) Correction<br />
If no values have been selected for the Decimal Value (DV), no correction<br />
should be selected. If Unit Values (UV) ranges were specified, the user<br />
has the option to change the out of range measurements to the last value<br />
that was recorded before the out of range measurement was recorded, or<br />
have it according to the max/min unit value as specified earlier. In this<br />
case the software will know if the value is under the minimum or maximum<br />
limit. After the correction has been made, the data needs to be<br />
reconverted under File – Reconvert Data, and data will be changed<br />
accordingly.<br />
8.7 Time Synchronize Data (TSD)<br />
Choose the Settings menu, TSD definition <strong>com</strong>mand. A dialog box<br />
appears:<br />
@Star-Oddi 2010. All Rights Reserved
<strong>User</strong> <strong>Manual</strong><br />
<strong>Mercury</strong> Graphic Supporting <strong>Software</strong><br />
Figure 8.10 Time Synchronic Data Settings<br />
If the user wants to time synchronize two or more data files, it is possible<br />
to select three options: 1 hour, 10 minutes, or 5 minutes. The restriction is<br />
that the sample interval selected must be greater than the initial interval,<br />
and it must also be dividable by the initial interval. For example, if the initial<br />
interval was 15 minutes, only the 1 hour option can be selected for time<br />
synchronizing.<br />
If the ‘Include empty cells’ is enabled, the data tables will be empty for<br />
those measurements in the original file that are not to be shown.<br />
If the user wants to activate this feature, the ‘Make TSD file when<br />
converting DAD-DAT’ must be enabled. For changing the current<br />
measurement file with one of the three intervals, the data must be<br />
reconverted by ‘File – Reconvert Data’.<br />
@Star-Oddi 2010. All Rights Reserved
<strong>User</strong> <strong>Manual</strong><br />
<strong>Mercury</strong> Graphic Supporting <strong>Software</strong><br />
8.8 Rate Of Change (ROC)<br />
This new feature gives the user a chance to see how fast the signal is<br />
changing, i.e. the estimated velocity of the signal. This applies to all<br />
measured parameters. The ROC is calculated via a two point numerical<br />
differentiation:<br />
ROC= (P2-P2)/(t2-t1)<br />
P: Parameter expressed in a user defined unit<br />
t: Time (hour, minute or second)<br />
The way the ROC is set up and viewed is very similar to the TSD.<br />
Under ‘Settings\ROC’ the ROC options can be set:<br />
Figure 8.11 ROC Definition<br />
The ROC is only <strong>com</strong>puted when a DAD->DAT conversion is performed,<br />
and when the user wishes. The time units are selectable as hour, minute<br />
or seconds. For small changes it can be convenient to express the ROC<br />
as a milli (10 -3 ) unit. For example if the temperature is in (°C) then milli<br />
degrees Celsius are expressed as (m°C).<br />
@Star-Oddi 2010. All Rights Reserved
<strong>User</strong> <strong>Manual</strong><br />
<strong>Mercury</strong> Graphic Supporting <strong>Software</strong><br />
The ROC can be viewed as a trend under ‘View\Data Trend and<br />
Table\Rate Of Change (ROC)’ or as tabulated data via<br />
‘View\Measurement Data\Rate Of Change’.<br />
Title<br />
8.9 Chart<br />
Click on the chart title in the chart window to change the title of the chart.<br />
A dialog box appears:<br />
Figure 8.12 Chart Title Dialog Box<br />
To change the chart title, enter a new text string and press the OK button.<br />
Time Axis<br />
To change the time scale of the chart, click on the X axis scale. A dialog<br />
box appears:<br />
@Star-Oddi 2010. All Rights Reserved
<strong>User</strong> <strong>Manual</strong><br />
<strong>Mercury</strong> Graphic Supporting <strong>Software</strong><br />
Figure 8.13 X-Axis Settings Dialog Box<br />
By disabling the Automatic option, the minimum and maximum time values<br />
be<strong>com</strong>e active. By clicking on the Change buttons for the maximum and<br />
minimum values, the time range can be specified. By enabling the<br />
Automatic option, the measurement time will go back to the initial range.<br />
Value Axis<br />
To change the scale settings for the value axis, click on either of the Y axis<br />
scale, for temperature. A dialog box appears:<br />
@Star-Oddi 2010. All Rights Reserved
<strong>User</strong> <strong>Manual</strong><br />
<strong>Mercury</strong> Graphic Supporting <strong>Software</strong><br />
Figure 8.14 Y-Axis Settings Dialog Box<br />
By disabling the Automatic option, the minimum and maximum<br />
measurement values be<strong>com</strong>e active. By clicking on the Change buttons<br />
for the maximum and minimum values, the temperature range to be shown<br />
on the chart can be specified. By enabling the Automatic option, the<br />
measurements will go back to the initial range.<br />
Chart Editor<br />
The Chart Edit button (on every graph) gives access to the Chart Editor, a<br />
multi-option menu, now with a Tree View interface:<br />
@Star-Oddi 2010. All Rights Reserved
<strong>User</strong> <strong>Manual</strong><br />
<strong>Mercury</strong> Graphic Supporting <strong>Software</strong><br />
Figure 8.15 Chart Editor<br />
There are four main branches on the tree:<br />
<br />
<br />
<br />
<br />
<br />
Series<br />
Chart<br />
Data<br />
Tools<br />
Export<br />
The tree menu gives access to the same features as the tab menu<br />
described in the user’s manual. Most of the changes invoked are viewable<br />
immediately.<br />
All format and style changes made to the chart, are lost if the data are<br />
viewed again or “Reconverted”, as the *.DAD and the *.DAT file are not<br />
affected by changes made to the chart or the database.<br />
Series<br />
The Series window offers the same features as the “Active Series List”<br />
button.<br />
@Star-Oddi 2010. All Rights Reserved
<strong>User</strong> <strong>Manual</strong><br />
<strong>Mercury</strong> Graphic Supporting <strong>Software</strong><br />
Figure 8.16 Format Series<br />
When a particular series is selected, like the Temperature series for<br />
example, a two tab menu is revealed, as seen in fig. 8.16, where the user<br />
can “format” each series, and set “points” in the graph. The tab “Point”<br />
offers visibility to points as the “Data Point Marker” button on the graph,<br />
plus formatting of the points.<br />
Chart<br />
The chart branch has six sub branches:<br />
Axis<br />
Titles<br />
Legend<br />
Panel<br />
Paging<br />
Walls<br />
Axis<br />
There are 8 axes in a normal <strong>Mercury</strong> chart, the number in use depends<br />
on the recorder type. The Left Axis and Custom 1 axis are always in use,<br />
the latter is reserved for the timeline.<br />
@Star-Oddi 2010. All Rights Reserved
<strong>User</strong> <strong>Manual</strong><br />
<strong>Mercury</strong> Graphic Supporting <strong>Software</strong><br />
Figure 8.17 Axis Formatting<br />
Figure 8.17 shows a six tab Axis menu. There are numerous options,<br />
some of which can drastically change the behavior of the graph. The<br />
Minimum and Maximum tabs give options similar to the menu offered<br />
when clicking an axis on the graph, the ticks tab gives access to enable<br />
and disable gridlines, just as in the “Horizontal gridline” and “Vertical<br />
gridline” buttons in the graph.<br />
Titles<br />
The Titles menu shown in figure 8.18, gives access to 4 tiles, each title a<br />
multi line text window, which can be positioned anywhere on the chart.<br />
There are multiple formatting options, six tabs, for each title.<br />
@Star-Oddi 2010. All Rights Reserved
<strong>User</strong> <strong>Manual</strong><br />
<strong>Mercury</strong> Graphic Supporting <strong>Software</strong><br />
Figure 8.18 Titles Menu<br />
Legend<br />
The legend menu (see figure 8.19) gives the user an option of showing a<br />
series legend.<br />
The 8 tab menu gives options in styling positioning and formatting the<br />
legend.<br />
Figure 8.19 Legend Menu<br />
@Star-Oddi 2010. All Rights Reserved
<strong>User</strong> <strong>Manual</strong><br />
<strong>Mercury</strong> Graphic Supporting <strong>Software</strong><br />
Panel<br />
The Panel menu (see figure 8.20) offers panel format options. Images,<br />
pictures and icons can be imported onto the panel as a back image.<br />
Figure 8.20 Panel Menu<br />
Paging<br />
With the Paging menu, shown in figure 8.21, the data series can be<br />
chopped into pages, with a user defined number of points per page. Only<br />
one page is shown at a time, and the user can scroll through the pages<br />
via the page buttons, that appear (are enabled) on the chart to the right of<br />
the Edit Chart button, when paging is selected.<br />
Paging can be useful for viewing distinct time periods, one at a time, days<br />
or hours for example. No offset is offered and sampling periods and start<br />
time can limit the usefulness of this option.<br />
Figure 8.21 Paging Menu<br />
@Star-Oddi 2010. All Rights Reserved
<strong>User</strong> <strong>Manual</strong><br />
<strong>Mercury</strong> Graphic Supporting <strong>Software</strong><br />
Walls<br />
Figure 8.22 Walls Menu<br />
The walls menu, as seen in figure 8.22, gives access to configuration of<br />
four walls, but as <strong>Mercury</strong> charts are default defined as 2D, only the<br />
“Back” wall is visible.<br />
The Walls menu, has similar options as the Panel menu, when defining a<br />
pattern, via the “Pattern…” button, as seen in figure 16, an image can be<br />
imported and placed on the wall. In fact, as the Back Wall lies “on top” off<br />
the panel, a pattern or an image can enhance an image on the panel, or<br />
the image on the panel can be seen through the wall with the<br />
Transparency option.<br />
Data<br />
In the data menu, seen in Figure 8.23, gives the user access to the<br />
database, upon which the chart rests. Here text labels can be set to each<br />
measurement point. Changes can be made to the time and measurement<br />
values. Changes made to the data, are included when the data is<br />
exported, but if the data are viewed again or “Reconverted” all changes<br />
are lost, as the *.DAD and the *.DAT file are not affected by changes<br />
made to the database.<br />
@Star-Oddi 2010. All Rights Reserved
<strong>User</strong> <strong>Manual</strong><br />
<strong>Mercury</strong> Graphic Supporting <strong>Software</strong><br />
Tools<br />
Figure 8.23 Data Menu<br />
Under 'Tools' you will find several options to customize the setting of the<br />
cursor and the appearance of the graph, such as page numbering, font,<br />
font size etc. To active/deactivate the chosen setting check/uncheck the<br />
'Active' box on top of the first page of this menu.<br />
Figure 8.24 First Page of Tools Menu<br />
@Star-Oddi 2010. All Rights Reserved
<strong>User</strong> <strong>Manual</strong><br />
<strong>Mercury</strong> Graphic Supporting <strong>Software</strong><br />
Export<br />
Under the Export menu, three tabs offer as many menus for saving data as<br />
Pictures<br />
Pictures<br />
Native (data)<br />
Data (file)<br />
Figure 8.25 Export Menu: Pictures<br />
Figure 8.25 shows options when saving the chart as a picture to a file, or<br />
copy the picture to the clipboard. There are seven format possibilities:<br />
<br />
<br />
<br />
<br />
<br />
<br />
<br />
Metafile<br />
Bitmap<br />
JPEG<br />
GIF<br />
PDF<br />
VML<br />
SVG<br />
@Star-Oddi 2010. All Rights Reserved
<strong>User</strong> <strong>Manual</strong><br />
<strong>Mercury</strong> Graphic Supporting <strong>Software</strong><br />
Native<br />
The Native menu, see figure 8.26, data is saved as “Native” *.tee chart<br />
files. Import of these files is not supported in <strong>Mercury</strong> at the moment.<br />
Figure 8.26 Export Menu: Native<br />
Data<br />
Data can be exported to files in four formats, see figure 8.27.<br />
<br />
<br />
<br />
<br />
Text file (.txt)<br />
XML (.xml)<br />
HTML (.hml)<br />
Excel (.xls)<br />
@Star-Oddi 2010. All Rights Reserved
<strong>User</strong> <strong>Manual</strong><br />
<strong>Mercury</strong> Graphic Supporting <strong>Software</strong><br />
There are four Include options:<br />
Figure 8.27 Export Menu: Data<br />
1. Point Index<br />
The point index is the same as the measurement number, but offset<br />
by -1, as it starts in 0 instead of 1.<br />
2. Point Labels<br />
If the user has added text labels to points in the DATA menu, these<br />
can be included.<br />
3. Header<br />
The same headers as are in the DATA menu.<br />
4. Point Colors<br />
This option is not relevant in <strong>Mercury</strong>.<br />
Another method for exporting is to use the Alt+PrintScreen keyboard<br />
buttons to copy an image of the <strong>Mercury</strong> window to the clipboard,<br />
thereafter to paste it to another Windows application. When a dialog box<br />
is open, then only that frame is copied to the clipboard.<br />
To copy a part of a data file, for example from a DAT file, then highlight the<br />
part you want to copy and use the Ctrl+C keyboard buttons to copy the<br />
data snippet to the clipboard. Then use the paste-option in another<br />
Windows application to transfer the data from the clipboard.<br />
@Star-Oddi 2010. All Rights Reserved
<strong>User</strong> <strong>Manual</strong><br />
<strong>Mercury</strong> Graphic Supporting <strong>Software</strong><br />
Figure 8.28 Highlighted Text to be Copied<br />
8.10Timeline<br />
The timeline is a graphical viewing aide. Every time a file is loaded for<br />
trending, an extra time value is calculated for every measurement point.<br />
These time values form the Timeline. The Timeline is an extra series that<br />
follows the rules of the other measurement series. When the graph first<br />
appears, the Timeline is inactive.<br />
By selecting the Timeline in the Series List (see fig. 8.29), the Timeline<br />
be<strong>com</strong>es visible as shown in figure 8.30.<br />
@Star-Oddi 2010. All Rights Reserved
<strong>User</strong> <strong>Manual</strong><br />
<strong>Mercury</strong> Graphic Supporting <strong>Software</strong><br />
Figure 8.29 Timeline Selection<br />
Figure 8.30 Timeline on a graph showing “Day of the Year”<br />
The Timeline is defined under Settings\Preferences\Timeline.<br />
There are several options for the Timeline, as can be seen in fig. 8.31.<br />
@Star-Oddi 2010. All Rights Reserved
<strong>User</strong> <strong>Manual</strong><br />
<strong>Mercury</strong> Graphic Supporting <strong>Software</strong><br />
Figure 8.31 Timeline Options<br />
There is no need to reconvert the data, as every time a data file is loaded,<br />
the Timeline is calculated in accordance with Timeline settings. The<br />
Timeline is not a part of the *:DAT or the *.TSD files, but if the data is<br />
exported (see the Export section), then the Timeline, if selected, will be<br />
included. Thus, the Timeline can also be used for statistical purposes.<br />
8.11Templates<br />
There are two scenarios where templates <strong>com</strong>e in handy:<br />
1. When many recorders are programmed with the same settings<br />
(multi mode), and circumstances are in a way that the user cannot<br />
<strong>com</strong>plete the setup of all the recorders in one session, and he has<br />
to exit <strong>Mercury</strong> (to continue later).<br />
2. When the user wants to reuse, partly or <strong>com</strong>pletely, presumably a<br />
<strong>com</strong>plex and/or lengthy measurement setting.<br />
Saving a Template<br />
The user can now, when editing New Measurement Settings (NMS), save<br />
his work by enabling “Save this NMS as a Template (file)” option (see fig.<br />
8.32), before acknowledging OK from the Edit NMS menu. Having<br />
selected this option and the NMS are OK, then the user has an option to<br />
write a description for the template (see fig. 8.33). Canceling this option<br />
cancels the ‘save template’ operation. The template is an INI file and<br />
saved in the <strong>Mercury</strong>\NMS directory. The name of the file is<br />
MSTtime.INI.<br />
@Star-Oddi 2010. All Rights Reserved
<strong>User</strong> <strong>Manual</strong><br />
<strong>Mercury</strong> Graphic Supporting <strong>Software</strong><br />
Figure 8.32 Template Options in Edit\New Measurement Sequence<br />
Figure 8.33 Saving NMS as a Template<br />
@Star-Oddi 2010. All Rights Reserved
<strong>User</strong> <strong>Manual</strong><br />
<strong>Mercury</strong> Graphic Supporting <strong>Software</strong><br />
Using a Template<br />
Templates can be retrieved at a later time to be used directly or modified.<br />
The list of templates is kept in the <strong>Mercury</strong>\templets.ini file.<br />
As can be seen in fig. 8.32 there are three buttons in the Edit NMS<br />
window, the top button is used for retrieving a template.<br />
As can be seen in fig. 8.34, templates are selected via template name or<br />
description. Parallel to selecting a template, descriptions can be edited<br />
and eventually templates deleted.<br />
The recorder type and interval type, which the template was based on, are<br />
visible for each template.<br />
Figure 8.34 Template Selection<br />
Templates can be used across recorder type boundaries and interval<br />
types.<br />
Things to keep in mind when selecting a template are:<br />
<br />
<br />
<br />
<br />
Single interval templates converted to a multiple interval NMS. All<br />
seven intervals are the same.<br />
Multiple interval templates converted to a single interval NMS, set<br />
the interval as interval one.<br />
Start time in the past is not allowed as will be apparent when exiting<br />
the Edit NMS window.<br />
Some recorder types are less <strong>com</strong>patible than others, an example<br />
of that is a DST milli template converted to a DST GPS NMS.<br />
@Star-Oddi 2010. All Rights Reserved
<strong>User</strong> <strong>Manual</strong><br />
<strong>Mercury</strong> Graphic Supporting <strong>Software</strong><br />
The user is returned to the edit window after selecting a template. If the<br />
selection is not as what the user expected the “Previous” button will<br />
return the previous setting.<br />
The user has one more option to quickly set up the NMS. The button in<br />
fig. 1, marked “Use Default”, will return default NMS settings. The button<br />
can have four descriptions and return four different settings depending on<br />
the status of recorder and measurement selection.<br />
1. Use Default: No recorder selected.<br />
2. Use Recorder: Recorder selected but not a measurement<br />
sequence.<br />
3. Use Sequence: Measurement sequence selected.<br />
4. Use Online: Recorder is on-line.<br />
@Star-Oddi 2010. All Rights Reserved
<strong>User</strong> <strong>Manual</strong><br />
<strong>Mercury</strong> Graphic Supporting <strong>Software</strong><br />
@Star-Oddi 2010. All Rights Reserved
<strong>User</strong> <strong>Manual</strong><br />
<strong>Mercury</strong> Graphic Supporting <strong>Software</strong><br />
9.Multiple Intervals<br />
<strong>Mercury</strong> has the option for setting up more than one sampling interval<br />
within a measurement sequence. Reasons for wanting multiple intervals<br />
can be to save memory, but still be able to have frequent measurements<br />
in between. This may be the case with fish tagging, when frequent<br />
recording is wanted in a specific period in the fish life cycle. If you want to<br />
run on a single interval the whole recording period, this option is not<br />
selected.<br />
By choosing Multiple Intervals (under Settings-Preferences-<br />
Measurement Intervals), multiple interval setup is activated. Thereafter,<br />
choose the Edit menu and New Measurement Sequence Definition<br />
<strong>com</strong>mand. The following dialog box appears:<br />
Figure 9.1 Setting new Measurement Sequence (with multiple intervals)<br />
@Star-Oddi 2010. All Rights Reserved
<strong>User</strong> <strong>Manual</strong><br />
<strong>Mercury</strong> Graphic Supporting <strong>Software</strong><br />
9.1 Start time<br />
The user defines the date and time when recordings should start.<br />
9.2 Measurement Interval<br />
The sampling interval (time between measurements) is defined. It is any<br />
value from 1 to 99 seconds, or 1 minute to 24 hours with increments of 1<br />
minute. Up to 7 different sampling intervals can be selected. If for example<br />
two intervals will be used, then only two intervals need to be filled out. If<br />
seconds are used as sampling interval, the multiple of the sampling<br />
interval and the number of measurements must be dividable by 60.<br />
Number of Measurements N1-N7<br />
The user defines the number of measurements to be recorded within each<br />
sampling interval. A value from 1 to 60000 must be set. Please note that<br />
an initial measurement is taken at the defined ‘start time’. This initial<br />
recording is not counted as a measurement for the ‘Interval 1’ number of<br />
measurements. For example if the recorder should measure every hour<br />
from midnight to ten o’clock (00:00 – 10:00), then the number of<br />
measurements defined should be 10. Please note that only this one<br />
measurement at the ‘start time’ does not count as a measurement for the<br />
intervals. In this case, the first measurement counted for the ‘Interval 1’ is<br />
at 01:00, and the last measurement is at 10:00, and then it shifts to<br />
another interval.<br />
After taking one measurement at the ‘start time’, the recorder will start on<br />
the first interval in the sequence and take the number of measurements as<br />
defined. After taking the measurements on the first interval, it will<br />
automatically shift to the next interval etc. The sampling intervals and<br />
number of measurements will recycle until memory is full, or until<br />
connection is made with the recorder through a PC <strong>com</strong>puter.<br />
Sequence 1-14<br />
The interval sequence must be filled out. As shown in figure 10.1, the<br />
user selects to use intervals 1-6 for the recordings. Another example:<br />
If two of the first sampling intervals are used, the sequence should be 1,<br />
2, 1, 2 etc., meaning that the recordings shift between the first and the<br />
second intervals, recording the defined number of measurement for the<br />
first interval, and then shifting to the second interval taking the number of<br />
@Star-Oddi 2010. All Rights Reserved
<strong>User</strong> <strong>Manual</strong><br />
<strong>Mercury</strong> Graphic Supporting <strong>Software</strong><br />
measurements defined. The shifting between the intervals repeats until<br />
memory is full, or until connection is made through a PC <strong>com</strong>puter.<br />
The Use Template can be used if older definitions have been saved by<br />
enabling the ‘Save this NMS as a template (file)’. That way it’s possible to<br />
get templates that have been set up in the past. With the Use Sequence<br />
button it is possible to get same settings as from other recorders, by<br />
browsing for their serial no. By hitting the Previous button the settings go<br />
back to previous, before changes were made.<br />
@Star-Oddi 2010. All Rights Reserved
<strong>User</strong> <strong>Manual</strong><br />
<strong>Mercury</strong> Graphic Supporting <strong>Software</strong><br />
@Star-Oddi 2010. All Rights Reserved
<strong>User</strong> <strong>Manual</strong><br />
<strong>Mercury</strong> Graphic Supporting <strong>Software</strong><br />
10. Reconvert Data<br />
In <strong>Mercury</strong> you have the option of reconverting data that has already been<br />
retrieved. After re-defining parameters, the data is reconverted by ‘File -<br />
Reconvert Data’. The main reasons for reconverting data are:<br />
<br />
<br />
<br />
<br />
<br />
<br />
<br />
Shift pressure/depth values according to a reference meter, to<br />
increase accuracy.<br />
Adjust measurements that are outside calibration range.<br />
Incorrect PC-time at measurement start time.<br />
Shortening the data file, i.e. cut out measurements above water.<br />
Need for temperature or pressure/depth unit alteration.<br />
Need for data file format alteration.<br />
(‘Settings – Preferences – Data File Format’).<br />
10.1Data Definition<br />
Under the Edit menu and Reconvert Definition, choose the Data<br />
Definition <strong>com</strong>mand, and the following dialog box appears:<br />
@Star-Oddi 2010. All Rights Reserved
<strong>User</strong> <strong>Manual</strong><br />
<strong>Mercury</strong> Graphic Supporting <strong>Software</strong><br />
Figure 10.1 Reconvert Data Definition<br />
Set Reconversion Measurement Sequence Start-Time<br />
If the user notes from retrieved data that the PC date and clock were<br />
incorrect when measurements were started, it is possible here to specify<br />
a new start date and start time.<br />
In Reconversion use Measurement Intervals from<br />
The measurement interval is either the interval settings as shown in the<br />
measurement (MID) file, or if that interval is incorrect, a new and correct<br />
sampling interval is specified in the ‘New Measurement Sequence<br />
Definition’ <strong>com</strong>mand in the ‘Edit’ menu.<br />
In Reconversion use Constants from<br />
The user can choose to use calibration constants from:<br />
@Star-Oddi 2010. All Rights Reserved
<strong>User</strong> <strong>Manual</strong><br />
<strong>Mercury</strong> Graphic Supporting <strong>Software</strong><br />
<br />
<br />
<br />
MID file. This option should normally be selected, as it contains<br />
information on the constants from the measurement sequence.<br />
RID file. The recorder information file contains the same calibration<br />
constants as the MID file, except if it has been re-calibrated. If it has<br />
been re-calibrated, and the user wants to use the new constants on<br />
older measurements, the RID option should be selected.<br />
RBD file. This option rarely needs to be selected. If the constants<br />
from the MID and RID file are corrupt, the user should contact Star-<br />
Oddi for an RBD file. See chapter A.3 for instructions on how to<br />
transmit the RBD files to the recorder.<br />
Convert Number of Data<br />
The user can reconvert all the data in the last measurement sequence, or<br />
define the number of measurements to be reconverted. The user has the<br />
option to define what measurement range should be reconverted (for<br />
example to exclude data points when the recorder was above water).<br />
Time Linear Adjustment<br />
The real time clock inside the DST has an accuracy of approximately +/-<br />
1 minute per month. This slight variation might accumulate over time and<br />
influence the measurement results. To correct the gradual time shift first<br />
check „linear adjustment time“ then type in the time offset value and the<br />
length of the measuring period.<br />
Out of Range Decimal Value Settings<br />
Measurements that are outside the calibration range are inaccurate, and<br />
may give erroneous results. The out of range (OOR) measurements can<br />
be seen in the OOR file. The user has the following decimal value out of<br />
range detection options when reconverting:<br />
Full scale (no boundaries). This means that literally no ‘out of<br />
range’ detection will be made.<br />
<strong>User</strong> definition. With this selection the range definition under<br />
‘Settings - Out Of Range - DV definition’ will be used. This option is<br />
selected when the decimal values (DV) are not available in the RID<br />
file. This would normally require the user to contact Star-Oddi for<br />
the decimal values.<br />
RID values. The calibration decimal range is given in the RID file.<br />
This is the default option and should normally be selected.<br />
@Star-Oddi 2010. All Rights Reserved
<strong>User</strong> <strong>Manual</strong><br />
<strong>Mercury</strong> Graphic Supporting <strong>Software</strong><br />
If an RBD file exists in the \<strong>Mercury</strong>\RBD folder, then <strong>Mercury</strong> recognizes<br />
this file as a primary source for DV calibration range. In this case, the<br />
fourth option appears and is set as default.<br />
10.2Temperature Definition<br />
Under the Edit menu and Reconvert Definition, choose the Temperature<br />
Definition <strong>com</strong>mand, and the following dialog box appears:<br />
Offset Adjustment<br />
Figure 10.2 Temperature offset Correction Menu<br />
When recorders are used over a long period of time, the temperature<br />
measurements can start to deviate from correct values.<br />
When checking older recorders, it has <strong>com</strong>e apparent that the error in the<br />
measurements is mainly due to an offset. Some users feel they can<br />
benefit from an offset correction option in <strong>Mercury</strong>, for example when a<br />
recorder has been in the water for a long time and is later tested to show<br />
an offset. The offset is defined in m°C (1°C = 1000 m°C).<br />
@Star-Oddi 2010. All Rights Reserved
<strong>User</strong> <strong>Manual</strong><br />
<strong>Mercury</strong> Graphic Supporting <strong>Software</strong><br />
10.3Single Spike Correction<br />
To enable single spike correction choose Edit-Reconvert Definitions-<br />
Temperature Definition (see figure 10.2).<br />
Check Use Single Spike Correction.<br />
There are two variables, Time and Limit. The Limit defines how much<br />
difference can be between two points over a defined Time.<br />
If a point is outside the range, +/- the limit of adjacent points. That point is<br />
then calculated as the average of the adjacent points.<br />
Reconvert Data<br />
After acknowledging the offset adjustments, the data need to be<br />
reconverted, for the adjustments to be effective: .<br />
View Previous Conversions<br />
Each time a reconversion is performed, a numbered file is created in the<br />
sequence folder.To view previous conversions select a file under View<br />
and choose Previous as can be seen in figure 10.3.<br />
@Star-Oddi 2010. All Rights Reserved
<strong>User</strong> <strong>Manual</strong><br />
<strong>Mercury</strong> Graphic Supporting <strong>Software</strong><br />
Figure 10.3 Previous Conversions<br />
The window in figure 10.4 appears. Select a numbered file from the dropdown<br />
list.<br />
Figure 10.4 Select Previous Conversions<br />
@Star-Oddi 2010. All Rights Reserved
<strong>User</strong> <strong>Manual</strong><br />
<strong>Mercury</strong> Graphic Supporting <strong>Software</strong><br />
Reconvert Previously Retrieved Data<br />
If data from the same sequence is retrieved more than once, a<br />
bookmarked data sequence file (DAD) is created. These files can be<br />
accessed and reconverted by choosing File-Reconvert data-Previous as<br />
can be seen in figure 10.5<br />
Figure 10.5 Reconvert Previously Retrieved Data<br />
@Star-Oddi 2010. All Rights Reserved
<strong>User</strong> <strong>Manual</strong><br />
<strong>Mercury</strong> Graphic Supporting <strong>Software</strong><br />
@Star-Oddi 2010. All Rights Reserved
<strong>User</strong> <strong>Manual</strong><br />
<strong>Mercury</strong> Graphic Supporting <strong>Software</strong><br />
11 Recorder Modes<br />
In this chapter, the three operational modes of DST are described, that is<br />
the PC Mode, Sleep Mode and Measurement Mode.<br />
11.1PC Mode<br />
If the recorder is in the correct position in the Communication Box, and by<br />
choosing the Recorder menu and the Connect <strong>com</strong>mand, the recorder is<br />
put into PC Mode. At the bottom of the <strong>Mercury</strong> window, the text On-line<br />
is displayed, indicating that the recorder is on-line and in PC Mode.<br />
While in PC Mode, the recorder will remain in an active listening stage.<br />
The <strong>com</strong>munication protocol is a simple master/slave arrangement, in<br />
which the recorder is the slave. The slave will perform every <strong>com</strong>mand the<br />
PC issues, and after execution of a <strong>com</strong>mand, it will return to listening.<br />
When the recorder is connected to the PC, it is powered by the PC, and<br />
not taking energy from the battery inside the recorder<br />
11.2Sleep Mode<br />
The user receives the recorder in Sleep Mode, but it can easily be<br />
awakened by the Connect <strong>com</strong>mand in the Recorder menu. If the<br />
recorder is not set in Measurement Mode, it goes into Sleep Mode when<br />
the recorder is removed from the Communication Box. When the recorder<br />
is in this mode, less energy is depleted from the battery.<br />
11.3Measurement Mode<br />
The recorder is put into Measurement Mode by choosing the Recorder<br />
menu, and Start New Measurements Sequence. The recorder starts<br />
recording measurements according to the start time (date/month/year)<br />
and sampling interval (hours/min.) defined by the user.<br />
When the memory is full, the recorder shifts automatically into Sleep<br />
Mode. If the recorder is still in Measurement Mode upon connection<br />
through a PC <strong>com</strong>puter, it stops recording and is put into PC Mode.<br />
@Star-Oddi 2010. All Rights Reserved
<strong>User</strong> <strong>Manual</strong><br />
<strong>Mercury</strong> Graphic Supporting <strong>Software</strong><br />
@Star-Oddi 2010. All Rights Reserved
Settings<br />
Settings<br />
<strong>User</strong> <strong>Manual</strong><br />
<strong>Mercury</strong> Graphic Supporting <strong>Software</strong><br />
12 Memory Organization<br />
Data is kept in an EEPROM memory and will not be lost if the battery fails<br />
or expires. The memory of the recorder is organized as shown in the figure<br />
below:<br />
Data memory<br />
<br />
New recordings<br />
Unused memory/<br />
Old recordings<br />
Figure 12.1<br />
Data Memory Organization<br />
When data is retrieved from the recorder, the following occurs:<br />
1. The <strong>com</strong>puter retrieves the data from the recorder and writes the<br />
data to the <strong>com</strong>puter’s hard drive .<br />
2. The recorder has stopped recording, but still holds the recorded<br />
data.<br />
When new settings are sent to the recorder, the following will occur:<br />
1. New settings are sent to the recorder.<br />
2. The data memory pointer is reset to the beginning of the data<br />
memory and starts to write over older recordings.<br />
The organization of the memory is now as follows:<br />
Data memory<br />
<br />
Unused memory/<br />
Old recordings<br />
Figure 12.2<br />
Data Memory with new Settings<br />
@Star-Oddi 2010. All Rights Reserved
<strong>User</strong> <strong>Manual</strong><br />
<strong>Mercury</strong> Graphic Supporting <strong>Software</strong><br />
@Star-Oddi 2010. All Rights Reserved
<strong>User</strong> <strong>Manual</strong><br />
<strong>Mercury</strong> Graphic Supporting <strong>Software</strong><br />
Appendix<br />
A.1 Directories and Files<br />
Directory Structure<br />
The user can choose between <strong>Mercury</strong>’s default data directory structure<br />
(path) or define his own data path. As the <strong>Mercury</strong> program is a multi<br />
recorder type program, the directory structure branches from the directory<br />
where <strong>Mercury</strong> is positioned down to type directories, i.e. DST micro,<br />
DST milli etc. From there it branches again into recorder directories,<br />
named after the serial numbers of the recorders, designed to hold data for<br />
each individual recorder (data directory). All in all it is a three level<br />
directory structure.<br />
An example of this directory structure with DST centi is:<br />
C:\<strong>Mercury</strong>\<br />
C:\<strong>Mercury</strong>\DST centi\<br />
The installation directory (<strong>Mercury</strong>.exe location)<br />
The type directory for DST centi<br />
C:\<strong>Mercury</strong>\DST centi\C2018\<br />
The directory for the C2018 recorder<br />
When a new recorder type is selected in <strong>Mercury</strong> (File – New Recorder<br />
Type), the directory for that recorder type is created. When connecting to<br />
a recorder for the first time, <strong>Mercury</strong> creates the recorder directory,<br />
named after the serial number of the recorder.<br />
Information Files<br />
<strong>Mercury</strong> uses information files to store and retrieve settings. There are<br />
two types of information files:<br />
1) The type-INI files, (for example DSTc.ini for DST centi).<br />
The information type files are all in the installation directory, they<br />
contain information on specific settings for each type. The type-INI files<br />
are:<br />
@Star-Oddi 2010. All Rights Reserved
<strong>User</strong> <strong>Manual</strong><br />
StarmonT.ini<br />
DSTm.ini<br />
DSTr.ini<br />
DSTu.ini<br />
DSTc.ini<br />
DSTs.ini<br />
DSTn.ini<br />
DSTx.ini<br />
Starmon mini<br />
DST milli<br />
DST milli recycle<br />
DST micro<br />
DST centi/centi ex<br />
DST CTD<br />
DST nano<br />
DST pitch & roll<br />
<strong>Mercury</strong> Graphic Supporting <strong>Software</strong><br />
2) The recorder-INI files, for example C2018.ini contains settings<br />
information and data file positioning for the C2018 recorder. The<br />
recorder-INI files are located in the appropriate type directory, i.e. all<br />
the Cxxxx.INI files are in the ‘DST centi’ directory.<br />
Files Locations<br />
As stated previously, the type-INI files are placed in the ‘<strong>Mercury</strong>’<br />
directory, and the recorder-INI files are placed in the recorder type<br />
directory. All other recorder and measurement related files created by<br />
<strong>Mercury</strong>, are placed in the appropriate recorder’s directory. For example:<br />
C:\<strong>Mercury</strong>\DST centi\C2018\ is a directory for the C2018 recorder and<br />
all files belonging to C2018 are placed there.<br />
If the user whishes to use his own defined data path, for example<br />
C:\Data\, then all the files for all the recorders, except for the INI files, are<br />
placed there. If the user has enabled the “Create recorder directories” in<br />
the user path definition, individual recorder directories, irrelative to type,<br />
are created under the user defined path, for example: C:\DATA\C2018\<br />
for the C2018 recorder. The C2018.ini file (located in the<br />
C:\<strong>Mercury</strong>\DST centi\) contains the path to the C:\Data\C2018\<br />
directory, and all files related to the C2018 will be placed in that<br />
particular directory.<br />
Browsing for a Recorder<br />
When browsing for a new recorder from the ‘Select recorder’ under the<br />
files menu, the default method is to find a recorder-INI file in the type<br />
directory. The INI file will then point to the data directory (the recorder’s<br />
directory). If the user has enabled the “Browse first in the user directory”<br />
in the user path definitions, the search starts in the user defined directory,<br />
where a *.RID file must be selected.<br />
@Star-Oddi 2010. All Rights Reserved
<strong>User</strong> <strong>Manual</strong><br />
<strong>Mercury</strong> Graphic Supporting <strong>Software</strong><br />
Recorder Related Files<br />
Every file that is recorder related has the following name format:<br />
Cxxxx: The name is the serial no. of the recorder<br />
Ext Description File type<br />
RID Recorder information data Binary<br />
RIT Recorder information text Text<br />
RBD Recorder backup data Binary<br />
RDD Recorder SNMS* download information data Binary<br />
RDT Recorder SNMS* download information text Text<br />
*SNMS: Start New Measurement Sequence<br />
The recorder ID (RIT) can at a later time be opened, and the related<br />
measurement data can be viewed, printed and reconverted. The RDD,<br />
RDT and DIR are download information files, created when a new<br />
measurement sequence is started.<br />
Measurement Related Files<br />
Every file that is specifically measurement related has the following name<br />
format:<br />
mmmCxxxx: The name is the measurement number + serial no.<br />
Ext Description File type<br />
MID Measurement information data Binary<br />
MIT Measurement information text Text<br />
MDD Measurement download information data Binary<br />
MDT Measurement download information text Text<br />
CIT Measurement conversion information text Text<br />
DAD Measurement Data Binary file Binary<br />
DAB Measurement Data Binary file Text<br />
DAT Measurement Data Binary data Text<br />
The MID, MIT and DAD files are created upon measurement data retrieval<br />
from the recorder. The DAB, DAT and CIT files are created when<br />
converting the data. The MDD and MDT are download information files<br />
and created when a new measurement sequence is started.<br />
Data Files<br />
Upon data retrieval, three main data files are created.<br />
@Star-Oddi 2010. All Rights Reserved
<strong>User</strong> <strong>Manual</strong><br />
<strong>Mercury</strong> Graphic Supporting <strong>Software</strong><br />
The *.DAD File<br />
This file is the raw data source file. The data is in mixed binary form. The<br />
user cannot access this file in the <strong>Mercury</strong> program. When converting<br />
these raw data into measurements, the *.MID file is needed. The result<br />
from the conversion are two data files, the *.DAB and the *.DAT.<br />
The *.DAB File<br />
This file contains sequential binary representation of the data in columns.<br />
The first column is the measurement number. The other columns contain<br />
the measured parameters in a binary form.<br />
The *.DAT File<br />
This is the actual result file, where the measurements are converted to<br />
their natural units and timed. This is a text file with columns. The first<br />
column is the measurement number, the second column the date and the<br />
time, depending on the set-up. The third column is the time or the first<br />
measured parameter, depending on set-up. The following column(s)<br />
contain the converted measured parameters with units and number of<br />
decimals according to set-up. Number of parameters can range from 1-3,<br />
and number of columns 3-6 accordingly.<br />
Data Header<br />
The *.DAT file contains a data header, which is a detailed description of<br />
how the *.DAT file is configured. This feature is used by <strong>Mercury</strong> when<br />
graphically representing the data, and is practical if the user wants to<br />
import the data into other applications or databases. Most of these<br />
descriptive items are derived from the ‘Settings’ menu and the recorder<br />
type definition in the ‘File’ menu.<br />
Each header item is contained in one line, and all header lines start with a<br />
# (bookmark) and a number. Then follows a description of the header<br />
item, and then 1-4 directives, all separated by tabs. Eventually a <strong>com</strong>ment<br />
trails the directives, preceded by a ; (semicolon)<br />
The following is a description of the directives contained in the data<br />
header.<br />
Item Description<br />
Number of directives<br />
#0 Date-time: 1<br />
The date and time of that particular *.DAT file creation.<br />
@Star-Oddi 2010. All Rights Reserved
<strong>User</strong> <strong>Manual</strong><br />
<strong>Mercury</strong> Graphic Supporting <strong>Software</strong><br />
#1 Recorder: 1<br />
The recorder and sequence number, f. example 12M1023<br />
Used for confirmation and as a graph header.<br />
#2 File type: 1<br />
Describes file column structure, mainly if Date and Time are joined<br />
(0-3)<br />
0: Result file Number Date Time Channels 1-3<br />
1: Result file Number Date & Time Channels 1-3<br />
2: Binary file Number Binary Channels 1-3<br />
#3 Columns: 1<br />
Total number of columns (3-6).<br />
#4 Channels: 1<br />
Number of measurement parameters (1-3).<br />
#5 Field separation: 1<br />
Separation between columns (0,1)<br />
0: Tab<br />
1: space<br />
#6 Decimal point: 1<br />
(0,1)<br />
0: Comma<br />
1: Dot<br />
#7 Date def.: 1<br />
Date format (0,1)<br />
0: dd mm yy<br />
1: mm dd yy<br />
#8 Time def.: 1<br />
Time separation (0,1)<br />
0: Colon (:)<br />
1: Dot (.)<br />
#9 Channel 1: 4<br />
Set as left axis, normally temperature. The four directives are:<br />
Axis header, unit: Text<br />
@Star-Oddi 2010. All Rights Reserved
<strong>User</strong> <strong>Manual</strong><br />
<strong>Mercury</strong> Graphic Supporting <strong>Software</strong><br />
Column header, unit: Text<br />
Number of decimals: (0-3)<br />
Axis direction (1,2)<br />
1: Ascending<br />
2: Descending<br />
#10 Channel 2: 4<br />
Set as right axis. The four directives are:<br />
Axis header, unit: Text<br />
Column header, unit: Text<br />
Number of decimals: (0-3)<br />
Axis direction (1,2)<br />
1: Ascending<br />
2: Descending<br />
#11 Re-conversion: 1<br />
Definition on conversion / Extra header in graph (0,1)<br />
0: Original conversion<br />
1: Reconverted<br />
@Star-Oddi 2010. All Rights Reserved
<strong>User</strong> <strong>Manual</strong><br />
<strong>Mercury</strong> Graphic Supporting <strong>Software</strong><br />
A.2 Help Menu<br />
Choose Help and the following window appears:<br />
<strong>User</strong> <strong>Manual</strong><br />
Figure A.1 Help Menu<br />
Select <strong>User</strong> <strong>Manual</strong> to open the <strong>Mercury</strong> user manual.<br />
Troubleshooting<br />
Select Troubleshooting to open the Trouble-Shooter.<br />
Release Notes<br />
Select Release Notes to view a description of the latest features added<br />
to <strong>Mercury</strong>, the date when they were added and a reference to the<br />
chapter number of each manual where the additions can be found.<br />
@Star-Oddi 2010. All Rights Reserved
<strong>User</strong> <strong>Manual</strong><br />
<strong>Mercury</strong> Graphic Supporting <strong>Software</strong><br />
About<br />
Select About for general information about <strong>Mercury</strong>.<br />
Check for Updates<br />
By selecting Check for Updates <strong>Mercury</strong> will automatically search the<br />
Star-Oddi website for the latest version of <strong>Mercury</strong>, <strong>User</strong> <strong>Manual</strong>,<br />
Trouble-Shooter and Release Notes. The program downloads and installs<br />
the latest updates to the software. Please note that this can only be done<br />
when the program is offline i.e. when no recorder is connected to the<br />
program.<br />
This is also done automatically every 30 days.<br />
A.3 Recorder Backup<br />
As mentioned in chapter 10, if the constants from the MID and RID file<br />
are corrupt, the user should contact Star-Oddi for a RBD file and transmit<br />
it to the recorder.The name of the backup file is Txxxx.RBD (serial no. of<br />
the recorder plus the .RBD ending).<br />
Downloading the backup file:<br />
1. Copy the backup files (RBD) into the <strong>Mercury</strong> RBD directory.<br />
2. Open the <strong>Mercury</strong> software.<br />
3. Plug a recorder to the PC <strong>com</strong>puter.<br />
4. Select the 'File' menu and 'Recorder backup' <strong>com</strong>mand and the<br />
following window appears:<br />
@Star-Oddi 2010. All Rights Reserved
<strong>User</strong> <strong>Manual</strong><br />
<strong>Mercury</strong> Graphic Supporting <strong>Software</strong><br />
Figure A.2 Select a Recorder *.RBD file<br />
Browse for the correct RBD file on the <strong>com</strong>puter and click OK.<br />
5. Insert the sequence number and remaining battery life (see figure A.3).<br />
Note that if the sequence number is set too low, data will be<br />
overwritten.<br />
Figure A.3 Set Sequence Number<br />
@Star-Oddi 2010. All Rights Reserved
<strong>User</strong> <strong>Manual</strong><br />
<strong>Mercury</strong> Graphic Supporting <strong>Software</strong><br />
6. The <strong>Mercury</strong> software downloads the RBD file into the recorder and<br />
the window in figure A.4 appears. Click OK.<br />
Figure A.4 Backup Operation<br />
@Star-Oddi 2010. All Rights Reserved