LOGITECH INTERNATIONAL SA - Shareholder.com
LOGITECH INTERNATIONAL SA - Shareholder.com
LOGITECH INTERNATIONAL SA - Shareholder.com

Create successful ePaper yourself
Turn your PDF publications into a flip-book with our unique Google optimized e-Paper software.
Table of Contents<br />
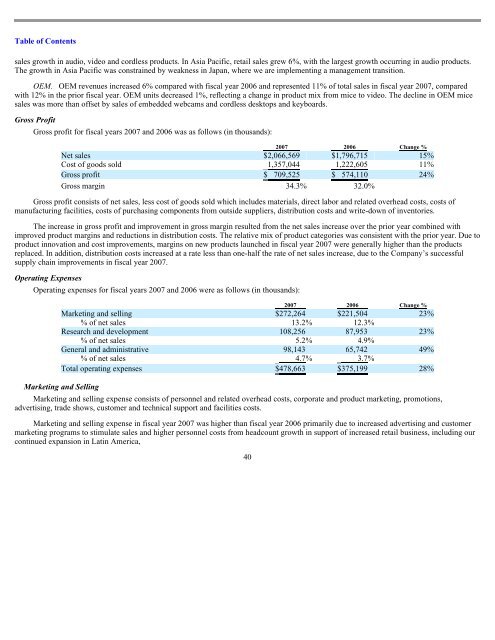
sales growth in audio, video and cordless products. In Asia Pacific, retail sales grew 6%, with the largest growth occurring in audio products.<br />
The growth in Asia Pacific was constrained by weakness in Japan, where we are implementing a management transition.<br />
OEM. OEM revenues increased 6% <strong>com</strong>pared with fiscal year 2006 and represented 11% of total sales in fiscal year 2007, <strong>com</strong>pared<br />
with 12% in the prior fiscal year. OEM units decreased 1%, reflecting a change in product mix from mice to video. The decline in OEM mice<br />
sales was more than offset by sales of embedded webcams and cordless desktops and keyboards.<br />
Gross Profit<br />
Gross profit for fiscal years 2007 and 2006 was as follows (in thousands):<br />
Gross profit consists of net sales, less cost of goods sold which includes materials, direct labor and related overhead costs, costs of<br />
manufacturing facilities, costs of purchasing <strong>com</strong>ponents from outside suppliers, distribution costs and write-down of inventories.<br />
The increase in gross profit and improvement in gross margin resulted from the net sales increase over the prior year <strong>com</strong>bined with<br />
improved product margins and reductions in distribution costs. The relative mix of product categories was consistent with the prior year. Due to<br />
product innovation and cost improvements, margins on new products launched in fiscal year 2007 were generally higher than the products<br />
replaced. In addition, distribution costs increased at a rate less than one-half the rate of net sales increase, due to the Company’s successful<br />
supply chain improvements in fiscal year 2007.<br />
Operating Expenses<br />
2007 2006 Change %<br />
Net sales $ 2,066,569 $ 1,796,715 15 %<br />
Cost of goods sold 1,357,044 1,222,605 11 %<br />
Gross profit $ 709,525 $ 574,110 24 %<br />
Gross margin 34.3 % 32.0 %<br />
Operating expenses for fiscal years 2007 and 2006 were as follows (in thousands):<br />
2007 2006 Change %<br />
Marketing and selling $ 272,264 $ 221,504 23 %<br />
% of net sales 13.2 % 12.3 %<br />
Research and development 108,256 87,953 23 %<br />
% of net sales 5.2 % 4.9 %<br />
General and administrative 98,143 65,742 49 %<br />
% of net sales 4.7 % 3.7 %<br />
Total operating expenses $ 478,663 $ 375,199 28 %<br />
Marketing and Selling<br />
Marketing and selling expense consists of personnel and related overhead costs, corporate and product marketing, promotions,<br />
advertising, trade shows, customer and technical support and facilities costs.<br />
Marketing and selling expense in fiscal year 2007 was higher than fiscal year 2006 primarily due to increased advertising and customer<br />
marketing programs to stimulate sales and higher personnel costs from headcount growth in support of increased retail business, including our<br />
continued expansion in Latin America,<br />
40