A comparative study of models for predation and parasitism
A comparative study of models for predation and parasitism
A comparative study of models for predation and parasitism

Create successful ePaper yourself
Turn your PDF publications into a flip-book with our unique Google optimized e-Paper software.
10<br />
The structure <strong>of</strong> <strong>predation</strong> is considered first. Suppose that there are x prey <strong>and</strong><br />
y predator individuals per unit area, <strong>and</strong> that each individual predator consumes, on<br />
the average, f(x) prey individuals per unit time. For the moment, the analytic <strong>for</strong>m<br />
<strong>of</strong> f(x) is not specified, but it is an assumed, increasing function <strong>of</strong> x.<br />
It is also<br />
assumed <strong>for</strong> the moment that the prey <strong>and</strong> predator numbers are fixed at X <strong>and</strong> Y<br />
respectively throughout one observation period t, i.e. that during t the prey population<br />
is replenished as fast as it is reduced by <strong>predation</strong>, <strong>and</strong> no increase or decrease<br />
occurs among the predators. Under these assumptions, the following will hold :<br />
n-~f(X) Yt (3.1)<br />
where n is the total number <strong>of</strong> prey killed by predators per unit area during t.<br />
capital letters <strong>for</strong> x <strong>and</strong> y indicate that these values are fixed during an observation<br />
period t.) At this stage, neither the effect <strong>of</strong> changes in the predator's psycho-physio-<br />
logical state nor the effect <strong>of</strong> social interaction is considered.<br />
(The<br />
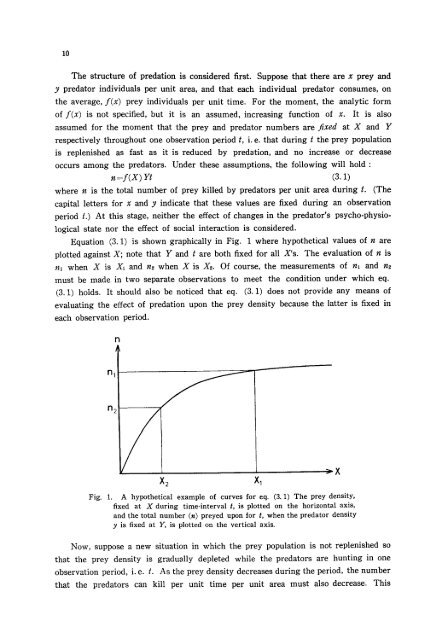
Equation (3.1) is shown graphically in Fig. 1 where hypothetical values <strong>of</strong> n are<br />
plotted against X; note that Y <strong>and</strong> t are both fixed <strong>for</strong> all X's. The evaluation <strong>of</strong> n is<br />
nl when X is X~ <strong>and</strong> n2 when X is Xz. Of course, the measurements <strong>of</strong> n~ <strong>and</strong> n~<br />
must be made in two separate observations to meet the condition under which eq.<br />
(3.1) holds. It should also be noticed that eq. (3.1) does not provide any means <strong>of</strong><br />
evaluating the effect <strong>of</strong> <strong>predation</strong> upon the prey density because the latter is fixed in<br />
each observation period.<br />
rl<br />
n~<br />
N<br />
y<br />
X2<br />
Fig. 1. A hypothetical example <strong>of</strong> curves <strong>for</strong> eq. (3. 1) The prey density,<br />
fixed at X during time-interval t, is plotted on the horizontal axis,<br />
<strong>and</strong> the total number (n) preyed upon <strong>for</strong> t, when the predator density<br />
y is fixed at Y, is plotted on the vertical axis.<br />
Now, suppose a new situation in which the prey population is not replenished so<br />
that the prey density is gradually depleted while the predators are hunting in one<br />
observation period, i.e.t.<br />
Xl<br />
As the prey density decreases during the period, the number<br />
that the predators can kill per unit time per unit area must also decrease. This<br />
>•