A comparative study of models for predation and parasitism
A comparative study of models for predation and parasitism
A comparative study of models for predation and parasitism

You also want an ePaper? Increase the reach of your titles
YUMPU automatically turns print PDFs into web optimized ePapers that Google loves.
73<br />
the curve must be decreasing <strong>for</strong> large values <strong>of</strong> Y. Although the pro<strong>of</strong> is<br />
curtailed here (because it can easily be confirmed by calculating the second<br />
order derivative), it should be mentioned that whether the rate <strong>of</strong> decrease is<br />
accelerated or decelerated depends on the rate <strong>of</strong> decrease in 2~(X) with increasing<br />
i; the curve is decreasing with an increasing rate if the value <strong>of</strong> 2<br />
decreases <strong>comparative</strong>ly fast as i increases, but the rate <strong>of</strong> decrease in the curve<br />
may become lower if the value <strong>of</strong> 2 decreases only slowly with increasing i.<br />
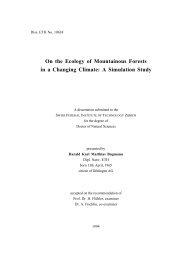
Some examples <strong>of</strong> curves generated by eq. (4i. 9) are shown in Fig. 12. These hypothetical<br />
curves cannot be compared directly with the observed curves <strong>and</strong> scattergram<br />
in Fig. 11, because the values <strong>of</strong> f(X), t, <strong>and</strong> ~ are not known in these observations.<br />
tOO<br />
0,50<br />
Xo(x} = 1.0<br />
e<br />
)h(x) = 0,5 I<br />
(i~<br />
1l<br />
0,10<br />
(1} o= 0<br />
(2) = 0,25<br />
0,0. ~<br />
13) = 0.50<br />
[z, ) = 0,75<br />
X<br />
:0<br />
l,f,-<br />
0<br />
=,<br />
~ 1.0C<br />
i ' ' ' I I<br />
0,1<br />
I I I L I I I i| I I I I I I I II I I<br />
1.0 10,0<br />
o~5o<br />
t<br />
{1)<br />
(2)<br />
0 , 2 0 , 5 , B,0,2,,,5 \ \,~,<br />
1.00 1,50 0,80 0.50 0.25 0,21 0.18 014 011 0.09 0.08 0.07<br />
1oo ,.,2o loo .... o.o oJo 0,50 o: 030 21; 0.27 ::: 0.25 ::; 0,23<br />
0,IC<br />
(1}<br />
..... 0:, . . . . . . . . ,'0 . . . . . . . . ,~0 ' '<br />
MEAN No. OF PARASITES PER EFFECTIVE AREA OF INTERACTION<br />
Fig. 12a. Hypothetical relationships between the values <strong>of</strong> ii/{f(X)t/X} <strong>and</strong> 6Y,<br />
(mean number <strong>of</strong> parasites per effective area) calculated from eqs. (4i. 6) <strong>and</strong><br />
(4i. 8), plotted in the natural logarithmic scale on both axes. The values <strong>of</strong><br />
2i (X) shown in the figure decreases as i increases, indicating that social<br />
interference only is considered here.<br />
Fig. 12b. The same as in Fig. 12a, but the value <strong>of</strong> 2i(X) increases from i=0<br />
to 1, indicating social facilitation, <strong>and</strong> then decreases towards higher values <strong>of</strong> i.