A comparative study of models for predation and parasitism
A comparative study of models for predation and parasitism
A comparative study of models for predation and parasitism

Create successful ePaper yourself
Turn your PDF publications into a flip-book with our unique Google optimized e-Paper software.
.... -o<br />
~ 300<br />
O<br />
1.1.1<br />
N<br />
I.--<br />
9 0BS.<br />
o- ..... ~ THEOR.<br />
20O<br />
nr"<br />
n<br />
U~<br />
U')<br />
0<br />
"r 100<br />
b-<br />
o<br />
Z<br />
/<br />
I<br />
I<br />
I I i i i i i J<br />
SO0 1000<br />
No. OF EGGS LAID (n)<br />
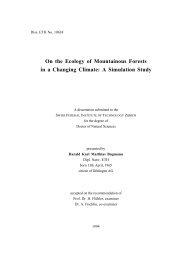
Fig. 10 b. A relationship between z <strong>and</strong> n actually observed with a parasite<br />
species, Encarsia <strong>for</strong>mosa G^~AN, laying eggs on its host species,<br />
Trialeurodes vaporariorum (W~sTW.), in BURNETT'S experiment. The<br />
solid line with black dots is the observed relationship <strong>and</strong> the broken<br />
line with open circles is the one expected from the binomial distribution<br />
(adapted from BURI~ET1" 1958; table IV).<br />
attacked is much closer to that expected by THOMPSON'S <strong>for</strong>mula <strong>for</strong> a r<strong>and</strong>om distri-<br />
bution <strong>of</strong> eggs. Thus the efficiency was on the whole raised in the second experi-<br />
ment as compared with the first; it should be noticed that <strong>for</strong> the lower numbers <strong>of</strong><br />
eggs laid, less super<strong>parasitism</strong> occurred than expected in a r<strong>and</strong>om distribution.<br />
Only two published sets <strong>of</strong> data are available to compare with my simulation<br />
model; in other published data, changes in the distribution pattern were not observed<br />
in accordance with the number <strong>of</strong> eggs laid. The first is BURNETT'S (1958) <strong>study</strong> <strong>of</strong><br />
the distribution <strong>of</strong> the eggs laid by Encarsia <strong>for</strong>mosa GAHAN on Trialeurodes vapora-<br />
riorum (WESTW.), in which periodic deviations from a r<strong>and</strong>om distribution in accord-<br />
ance with the number <strong>of</strong> parasites searching is clearly shown.<br />
For <strong>comparative</strong><br />
purposes, the number <strong>of</strong> hosts attacked is plotted against the number <strong>of</strong> eggs laid<br />
by all parasites (Fig. 10b, adapted from BURNETT'S table IV). A striking similarity,<br />
in the way that the observed curve deviates from the expected, is immediately apparent<br />
in Fig. 10a<strong>and</strong> b.<br />
BURNETT (Op. cit.) also showed a periodic deviation from a r<strong>and</strong>om distribution<br />
in accordance with changes in host density, rather than parasite density. Although I<br />
did not attempt to make any simulation experiment to compare with this experiment<br />
by BURNETT, the result may be deduced from Fig. 10a <strong>and</strong> b. Obviously, the curves<br />
shown in Fig. 10a <strong>and</strong> b are cross-sections <strong>of</strong> the hunting surface (as in Fig. 3a)<br />
parallel to the z-Yt plane, whereas the figure <strong>for</strong> BURNETT'S second experiment is<br />
a cross-section parallel to the z-xo plane. Now, the periodicity <strong>of</strong> waves (or wave<br />
length) is likely to be subject to change according to the initial prey density x0.<br />
That is, it is likely that the wave length becomes longer as x0 increases, since the