A comparative study of models for predation and parasitism
A comparative study of models for predation and parasitism
A comparative study of models for predation and parasitism

You also want an ePaper? Increase the reach of your titles
YUMPU automatically turns print PDFs into web optimized ePapers that Google loves.
5T<br />
dency towards a number <strong>of</strong> miniature waves. The explanation <strong>of</strong> this trend is rather<br />
simple. As the direction <strong>and</strong> the length <strong>of</strong> each path are determined by chance, the<br />
predator's track is a kind <strong>of</strong> MA~KOV'S chain, although the probability distributions<br />
<strong>of</strong> both the direction <strong>of</strong> directed paths <strong>and</strong> the length <strong>of</strong> all paths are dependent<br />
stochastically on the location <strong>of</strong> the prey which were encountered9 This is a complex<br />
(or a generalized) 'r<strong>and</strong>om walk'9 Thus the predator's path <strong>of</strong> search was <strong>of</strong>ten<br />
deflected in an irregular manner <strong>and</strong>, because <strong>of</strong> the nature <strong>of</strong> a 'r<strong>and</strong>om walk', the<br />
predator tended to stay in a restricted area <strong>for</strong> some time. Consequently, the prey<br />
density in that vicinity was gradually depleted, <strong>and</strong> this caused a temporary drop in<br />
the predator's hunting efficiency. However, as the density <strong>of</strong> prey in the vicinity was<br />
lowered, the predator's undirected paths increased in length <strong>and</strong> eventually led to a<br />
pIace where the prey had not been exploited. Then the hunting efficiency increased<br />
temporarily be<strong>for</strong>e decreasing again. Thus the hunting curve was a kind <strong>of</strong> composite<br />
competition curve <strong>and</strong> became wavy. Figure 8 also includes a curve (broken line)<br />
calculated from eq. (4e. 9) <strong>for</strong> the same values <strong>of</strong> R <strong>and</strong> V (h=0, <strong>of</strong> course)9 The<br />
observed curve in this simulation model is always lower than the calculated one,<br />
but this is because factor h is not considered (see p. 54).<br />
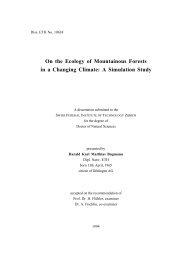
Now, the same principle should also apply to an indiscriminate parasite9 The<br />
same set-up was used again except that none <strong>of</strong> the points (hosts) was removed from<br />
the area <strong>and</strong> parasitized hosts were left exposed to super<strong>parasitism</strong>. It was assumed<br />
that one egg was laid at each encounter. The result <strong>of</strong> the first experiment is shown<br />
•,,• 100<br />
ILl<br />
N<br />
I-.-<br />
8C<br />
/-<br />
2 OBS. .o'"<br />
/ "/jl~ -o<br />
c>- ..... ~ THEOR. /-'/<br />
O'/<br />
oJ"<br />
o<br />
n<br />
k.-<br />
if)<br />
O<br />
212<br />
tL<br />
O<br />
o<br />
Z<br />
9<br />
4s<br />
2c<br />
/<br />
~<br />
..ff7<br />
I I L i i i<br />
0 50 73 93 I10 13C, ~5~<br />
No. OF EGGS LAID (.n)<br />
Fig. 9. An observed relationship (solid line with black dots) between<br />
the total number <strong>of</strong> hosts parasitized (z) <strong>and</strong> the total number <strong>of</strong><br />
eggs laid (n) in the~first serie~<strong>of</strong> Monte Carlo simulation <strong>of</strong> the<br />
<strong>parasitism</strong> model <strong>of</strong> continuous search. The broken line with open<br />
circles is a theoretical relationship expected from the binomial distribution9