Clinician's Guide - Bio-Medical Instruments, Inc.
Clinician's Guide - Bio-Medical Instruments, Inc.
Clinician's Guide - Bio-Medical Instruments, Inc.

Create successful ePaper yourself
Turn your PDF publications into a flip-book with our unique Google optimized e-Paper software.
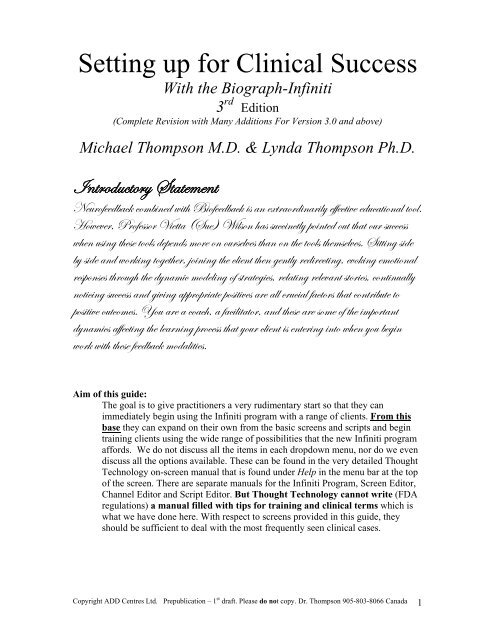
Setting up for Clinical Success<br />
With the <strong>Bio</strong>graph-Infiniti<br />
3 rd Edition<br />
(Complete Revision with Many Additions For Version 3.0 and above)<br />
Michael Thompson M.D. & Lynda Thompson Ph.D.<br />
\ÇàÜÉwâvàÉÜç fàtàxÅxÇà<br />
axâÜÉyxxwutv~ vÉÅu|Çxw ã|à{ U|Éyxxwutv~ |á tÇ xåàÜtÉÜw|ÇtÜ|Äç xyyxvà|äx xwâvtà|ÉÇtÄ àÉÉÄA<br />
[ÉãxäxÜ? cÜÉyxááÉÜ i|xààt ;fâx< j|ÄáÉÇ {tá áâvv|ÇvàÄç ÑÉ|Çàxw Éâà à{tà ÉâÜ áâvvxáá<br />
ã{xÇ âá|Çz à{xáx àÉÉÄá wxÑxÇwá ÅÉÜx ÉÇ ÉâÜáxÄäxá à{tÇ ÉÇ à{x àÉÉÄá à{xÅáxÄäxáA f|àà|Çz á|wx<br />
uç á|wx tÇw ãÉÜ~|Çz àÉzxà{xÜ? }É|Ç|Çz à{x vÄ|xÇà à{xÇ zxÇàÄç Üxw|Üxvà|Çz? xäÉ~|Çz xÅÉà|ÉÇtÄ<br />
ÜxáÑÉÇáxá à{ÜÉâz{ à{x wçÇtÅ|v ÅÉwxÄ|Çz Éy áàÜtàxz|xá? ÜxÄtà|Çz ÜxÄxätÇà áàÉÜ|xá? vÉÇà|ÇâtÄÄç<br />
ÇÉà|v|Çz áâvvxáá tÇw z|ä|Çz tÑÑÜÉÑÜ|tàx ÑÉá|à|äxá tÜx tÄÄ vÜâv|tÄ ytvàÉÜá à{tà vÉÇàÜ|uâàx àÉ<br />
ÑÉá|à|äx ÉâàvÉÅxáA lÉâ tÜx t vÉtv{? t ytv|Ä|àtàÉÜ? tÇw à{xáx tÜx áÉÅx Éy à{x |ÅÑÉÜàtÇà<br />
wçÇtÅ|vá tyyxvà|Çz à{x ÄxtÜÇ|Çz ÑÜÉvxáá à{tà çÉâÜ vÄ|xÇà |á xÇàxÜ|Çz |ÇàÉ ã{xÇ çÉâ uxz|Ç<br />
ãÉÜ~ ã|à{ à{xáx yxxwutv~ ÅÉwtÄ|à|xáA<br />
Aim of this guide:<br />
The goal is to give practitioners a very rudimentary start so that they can<br />
immediately begin using the Infiniti program with a range of clients. From this<br />
base they can expand on their own from the basic screens and scripts and begin<br />
training clients using the wide range of possibilities that the new Infiniti program<br />
affords. We do not discuss all the items in each dropdown menu, nor do we even<br />
discuss all the options available. These can be found in the very detailed Thought<br />
Technology on-screen manual that is found under Help in the menu bar at the top<br />
of the screen. There are separate manuals for the Infiniti Program, Screen Editor,<br />
Channel Editor and Script Editor. But Thought Technology cannot write (FDA<br />
regulations) a manual filled with tips for training and clinical terms which is<br />
what we have done here. With respect to screens provided in this guide, they<br />
should be sufficient to deal with the most frequently seen clinical cases.<br />
Copyright ADD Centres Ltd. Prepublication – 1 st draft. Please do not copy. Dr. Thompson 905-803-8066 Canada 1
Setting up for Clinical<br />
Success<br />
With the <strong>Bio</strong>graph-Infiniti<br />
3 rd Edition<br />
(Complete Revision with Many Additions for Version 3.0 and above)<br />
Michael Thompson M.D. & Lynda Thompson Ph.D.<br />
We suggest you work through the first 26 pages and, in particular, QUICK-START pages<br />
9-15 (becoming familiar with Channel sets and screens and starting a client). Then pick<br />
and choose areas of interest from this table of contents (Part 5, Display Screens [pp 87-<br />
118], may be particularly for helpful for new users).<br />
Table of Contents<br />
Introductory Statement<br />
Aim of this <strong>Guide</strong> Book and Accompanying Screens<br />
Authors Background<br />
Reason for Writing this <strong>Guide</strong><br />
Centre Description<br />
Executive Summary 7<br />
Basic Organization of this <strong>Guide</strong><br />
8<br />
Your Computer<br />
Page<br />
5<br />
READ I to IV to get started<br />
I. Your First Day<br />
i. Becoming comfortable with Channel Sets and Screens<br />
• Contents of each Channel Set<br />
• Which one to use & Why for each band width<br />
Becoming familiar with Display Screens<br />
9<br />
10<br />
11<br />
ii. Starting a Client (yourself first)<br />
II. A Way of Picturing the Program<br />
The “Town Houses”<br />
• Power values’ and ‘Spectral Magnitudes’ (advanced consideration)<br />
• Understanding “values” seen in Infiniti MT assessment screen<br />
• The Raw EEG Wave (Understand how the wave you see is derived)<br />
• Special Excel Assessment Summary<br />
16<br />
18<br />
19<br />
20<br />
II. MT Channel Sets (quick overview)<br />
Copyright ADD Centres Ltd. Prepublication – 1 st draft. Please do not copy. Dr. Thompson 905-803-8066 Canada 2
• Looking at Data Collected in One Channel Set using a Different<br />
Channel Set:<br />
• Excel Running In the Background (How to use this to help client)<br />
23<br />
24<br />
IV. How to use the rest of this <strong>Guide</strong> 25<br />
*************************************<br />
Part 1. MT Channel Sets and Screens -more detail<br />
• Quick review of excel summary of assessment statistics<br />
• 1 Hz Assessment Channel Sets<br />
• One Channel Feedback Channel Set<br />
• Main EEG band-width ‘bins’<br />
31<br />
• Screen Complexity –Why & how to simplify<br />
31<br />
Terms Used Display Screen Names 31-<br />
• Measurements: points, microvolts, % time> C 32<br />
• Special Kind of Training – changing the damper 33<br />
(speed of feedback)<br />
• File Names - letters in front of name: A, B, C….. 35<br />
26<br />
29<br />
Part 2: Quick Reference: Print these 2 pages out for new<br />
staff<br />
39<br />
40<br />
Part 3: Overview of the Infiniti<br />
41<br />
I. Overview<br />
43<br />
Suggestions for starting training with Children and adults<br />
45<br />
II. Running the Infiniti Program 46<br />
Introduction (Channel Set Options)<br />
A. Let’s Get Started 47<br />
B. Doing an Assessment<br />
a. EEG Assessment<br />
Removing Artifacts from the EEG<br />
b. Psychophysiological Stress Assessment<br />
C. Starting Feedback<br />
a. Trouble Shooting Battery and Attachments<br />
b. Statistics, Impedances. Frequency Bands, Dampers …<br />
i. Check Impedance<br />
ii. Changing Frequency Band Width Parameters<br />
iii. Changing Damper Settings (speed of bargraph movement)<br />
iv. Set Your Threshold % time > C<br />
v. Writing in a ‘Description’ of a Session<br />
vi. Notes on Statistics<br />
vii. Using Means for Starting Thresholds<br />
viii. While Running a Display Screen: Changing Scale or Thresholds<br />
ix. Hiding <strong>Instruments</strong><br />
x. Dual Monitors<br />
Copyright ADD Centres Ltd. Prepublication – 1 st draft. Please do not copy. Dr. Thompson 905-803-8066 Canada 3<br />
47<br />
50<br />
52<br />
53<br />
55<br />
56<br />
57<br />
58<br />
60<br />
61<br />
61<br />
62<br />
63<br />
65
III. SCREEN EDITOR: Changing a display screen from the Infiniti program<br />
using ‘Edit Selected Screen in Screen Editor’. Note: Much more detail is<br />
given below under Part 4: How to Make a Display Screen.<br />
i. Introduction<br />
ii. Animations<br />
iii. Sound<br />
iv. Other Variables (colour, text, label and so on)<br />
66<br />
66<br />
67<br />
68<br />
IV. CHANNEL SETS<br />
69<br />
How to change or make a channel set (advanced)<br />
V. BACKING-UP Your Display Screens, Scripts and Data 72<br />
VI. Other Useful Channel Sets and Screens<br />
These are screens that come with the program – not the MT channel set.<br />
PART 4. How to Make a Display Screen<br />
SKIP THIS until you are an ‘expert’.<br />
i. Introduction<br />
ii. Order for putting instruments on screens (important)<br />
iii. Inhibit <strong>Instruments</strong><br />
iv. Enhance <strong>Instruments</strong><br />
v. Counters<br />
vi. Enhance Point Counters<br />
vii. % time > threshold Counters<br />
viii. Labels<br />
ix. Animations<br />
x. Sound<br />
xi. Points Counter<br />
xii. Making a Counter<br />
xiii. Making a Spectrum<br />
xiv. Counter Instrument for Bowling Strikes<br />
xv. Threshold …. Time % > C Computations<br />
xvi. Some terms Used In Building Screens<br />
73<br />
74<br />
74<br />
75<br />
76<br />
78<br />
78<br />
79<br />
83<br />
84<br />
85<br />
86<br />
86<br />
Copyright ADD Centres Ltd. Prepublication – 1 st draft. Please do not copy. Dr. Thompson 905-803-8066 Canada 4
Part 5: Description of Selected Display Screens<br />
Use this section early on!!<br />
i. Assessment Screens<br />
ii. Child Screen Bowling - how to make similar screens: tri-plane,<br />
Pot-O-Gold, Venice…<br />
iii. Shaping with the Skeleton Screen<br />
iv. The Sail-Boat Screen – Mental State Control<br />
v. The Balance Beam Screen and Variations such as Mouse Walk<br />
vi. Adult 1 Monitor: EEG and <strong>Bio</strong>feedback<br />
vii. Heart Rate Variability<br />
viii. Alpha Theta<br />
ix. Dual Monitor Screens<br />
x. Dual Monitor Assessment Screens<br />
xi. F Screens for Self Regulation (mental state ║ frequency band)<br />
xii. Dual Monitors – The ‘Universal’ Screens (Make your own screen)<br />
xiii. Stress Assessment Display Screen - PROCEDURE<br />
xiv. Stress Assessment Review Screen<br />
87<br />
88<br />
92<br />
95<br />
97<br />
98<br />
101<br />
103<br />
104<br />
107<br />
109<br />
110<br />
110<br />
115<br />
118<br />
Part 6: 2 Channel Training<br />
xv.<br />
xvi.<br />
xvii.<br />
Part 7: Appendix<br />
Coherence Screens & Procedure<br />
2 Channel Assessment Screen<br />
2 Channel Training Screens<br />
i. Moving Client Files from One Computer to Another<br />
ii. Recording Statistics During the Session – the use of ‘Word’<br />
iii. The ADD Centre Sheets for Session Notes and Graphing<br />
iv. Comodulation (Spectral Correlation)<br />
v. Hiding Screens<br />
vi. Some Further notes about Screens<br />
vii. Installing new programs<br />
viii. A game to Decrease Variability<br />
ix. 2 Channel Excel Comparison<br />
x. 2 Channel Special Comparison Sheet<br />
xi. ‘Power values’ and ‘Spectral Magnitudes’<br />
xii. OPTIMIZE ATHLETIC performance<br />
121<br />
123<br />
132<br />
133<br />
136<br />
138<br />
141<br />
144<br />
146<br />
146<br />
146<br />
147<br />
148<br />
152<br />
Special Note:<br />
This document is a practical ‘getting started’ guide with a selection of<br />
‘advanced’ notes. You should use it while you are running the program.<br />
Copyright ADD Centres Ltd. Prepublication – 1 st draft. Please do not copy. Dr. Thompson 905-803-8066 Canada 5
The Authors, Instrumentation at the Authors’ Centre and The<br />
Production of this <strong>Guide</strong><br />
Our backgrounds span education, psychology, anthropology, learning centres, medicine,<br />
family therapy, biochemistry, physiology, neuroanatomy and the EEG. We have had the<br />
opportunity to learn this new emerging field through working with more than two<br />
thousand clients over more than a dozen years. At the ADD Centre / <strong>Bio</strong>feedback<br />
Institute we have 16 instruments (plus 7 spares) from 12 different manufacturers. We like<br />
to emphasize that all the instruments from the different manufacturers have positives that<br />
are helpful. The depth of programs and instrumentation from Thought Technology is the<br />
reason it has been the most frequent choice of equipment by our staff. This manual has<br />
been written to help with their training. The Centre has over 25 consulting staff who act<br />
as trainers so maintaining consistent high quality work is a priority and staff training is an<br />
on-going task. We also train professionals from many corners of the globe. This has made<br />
us aware that there is a need for an easy starting point for other users of the Thought<br />
Technology equipment and this is an additional motivation for writing this ‘<strong>Guide</strong>’.<br />
Thought Technology did not ask us to write this nor are they, or could they, pay for the<br />
time put into it. It started, like The Neurofeedback Book, as a manual for our staff and<br />
for the professionals who come from many corners of the globe who we are training.<br />
Thought Technology generously offered to have their staff work on the screens that we<br />
suggested and get out the bugs. The <strong>Bio</strong>feedback Foundation of Europe then kindly<br />
offered to pay the costs of reproducing disks and do the work of making this guide and its<br />
accompanying screens available over the internet. The screens and this book are<br />
purchased from BFE.org and payment is made to BFE. Profits made by BFE go towards<br />
the educational work of the <strong>Bio</strong>feedback Foundation of Europe. We want to thank both<br />
Thought Technology and BFE their time and their patience. A special thanks to Hal,<br />
Larry, Frank, Theresa, Mark and Didier who have put up with unending frantic calls for<br />
help without ever a murmur of complaint. They have even responded rapidly to our<br />
suggestions for changes in the program to make it easier for trainers to use.<br />
Our reward lies in the hope that this guide and the accompanying screens that we have<br />
field tested with a hundreds of clients, ranging in age from 4 to 68, may be of some help<br />
to you. If it is then it is worth all the time and effort. Thank you for trying out some of<br />
these ideas. All feedback is most welcome and is encouraged. Our website is:<br />
Hwww.addcentre.com and the e-mail is: addcentre@gmail.com.<br />
Executive Summary<br />
The screens that accompany this guide are in groups labelled A, B, C and so on. Each<br />
letter designates a commonly used group of screens to meet the needs of different types<br />
of clients. Group A and B are for SMR and task oriented beta training respectively.<br />
Groups C, D and E are used mainly with older adolescents and adults. They can involve<br />
combinations of biofeedback and neurofeedback . The NFB portion in these screens often<br />
addresses problems associated with ruminations and anxiety and the high beta (> 20 Hz)<br />
correlates of these symptoms. There are a few screens for specific purposes such as those<br />
under F for learning to control mental states, H for heart rate variability, M for coherence<br />
(at the present time these use a specialized channel set for this purpose) and hopefully<br />
Copyright ADD Centres Ltd. Prepublication – 1 st draft. Please do not copy. Dr. Thompson 905-803-8066 Canada 6
later for comodulation, and S for special work such as alpha / theta feedback. The<br />
objectives and descriptions for a few screens for each group are given at the end of this<br />
guide.<br />
A special group of screens labelled “Universal” are dual monitor screens that allow you<br />
to easily make a new screen for a specific client. These are included because it is time<br />
consuming to make new screens, therefore we have made a single screen that works with<br />
2 monitors that, for the most part, contains all the instruments you are most likely to need<br />
to initially work with your clients. The idea behind this is to allow the reader to<br />
customize a screen for a client: merely go to screen editor, left click on any instrument,<br />
and move it to the client screen. Do the same to remove unwanted instruments from the<br />
client screen. This means that, almost from the first day you can customize your feedback<br />
screens for particular clients without losing any of the data you, as a trainer, want to be<br />
able to observe.<br />
We have gone through the lengthy procedure of describing how to make your own screen<br />
but we recommend that you skip this until you have lots of time and are very familiar<br />
with the program and with doing minor editing on the screens that you have. Minor<br />
editing allows you to make many new screens from the ones provided here without<br />
starting from scratch.<br />
INTRODUCTION<br />
Goal<br />
To carry out responsible work that flows from the client’s stated objectives, their stated<br />
symptom picture, and their EEG patterns.<br />
Practical Considerations the Author had Before Designing the Channel<br />
Sets:<br />
a. For EEG<br />
The Trainer or Therapist<br />
• Has a maximum of 50 minutes to work with a client.<br />
• Should observe the raw EEG and its spectrum with the client each session<br />
• Should review what they will do that session and why in light of the EEG<br />
Therefore<br />
• Trainers should be able to collect and review an EEG sample taking no longer than<br />
a couple of minutes to review, artifact and discuss about a minute of data.<br />
• Client should be able to easily visualize the data<br />
• during the brief assessment /review of the EEG<br />
• when examining how the spectral array and ratios relate to raw EEG<br />
b. For Physiological Variables (other biofeedback modalities)<br />
• Clients should be able to see the correspondence of changes in their<br />
physiological variables to periods of stress alternating with relaxation.<br />
• A summary graph showing all modalities across the same time frame is<br />
essential.<br />
Copyright ADD Centres Ltd. Prepublication – 1 st draft. Please do not copy. Dr. Thompson 905-803-8066 Canada 7
• The time frame must be adjustable so the clinician and their client can<br />
• See the whole time period with all conditions<br />
• to compare stress with relaxation<br />
• Select small time periods to obtain statistics that are artifact<br />
free.<br />
The MT channel sets and display screens meet these criteria.<br />
1 st Your Computer:<br />
Laptop: Must be Pentium M or Equivalent (NOT Celeron)<br />
Desktop: Must be AMD AHTHLON (NOT Sempron) The key is to have the necessary<br />
size of ‘bus’ and “cache” memory L1 and L2.<br />
YOUR FIRST DAY<br />
i. Becoming Comfortable with Channel Sets and Screens<br />
A. Becoming Familiar with the Contents (EEG band measurements and<br />
physiological measures) Within Each Channel Set:<br />
Before you start with your first client, put electrodes and physiological sensors on<br />
yourself for a day – preferably in a quiet spot overlooking a lake.<br />
1. Go to ‘Start Open Display Session’, add a new client, yourself, and click “Define<br />
New Session”.<br />
2. Under, ‘Please select an encoder communication protocol’, select your<br />
instrument. You probably have the ‘Infiniti’ but if you have a ‘procomp2’ or a<br />
Procomp+, click on “Legacy”.<br />
Copyright ADD Centres Ltd. Prepublication – 1 st draft. Please do not copy. Dr. Thompson 905-803-8066 Canada 8
3. For the Infiniti (do the same steps for the procomp2 but the channel set names<br />
begin with P2 MT) click on PI MT 1EEG Physio-HRV FB.chs<br />
4. At the bottom of the screen you can click on ‘Channel Set Configuration.’ If you<br />
do, the following screen will appear.<br />
5. The left hand side shows the encoder input that is used for each of the sensors.<br />
The EMG channels A and B sample very quickly (>2500 per second). The other<br />
channels sample at 250 per second. With this channel set the sensors must be<br />
plugged in to the listed channels. If you highlight EMG or EEG you can click<br />
toggle and see the sensor type change. I have had to do this when accidentally the<br />
computer got a mind of its’ own and changed the EEG sensor name without my<br />
knowing. I could not do an impedance check and had to go into this screen and<br />
toggle it back to the correct sensor (EEG-Z) then impedance checks worked<br />
perfectly.<br />
Copyright ADD Centres Ltd. Prepublication – 1 st draft. Please do not copy. Dr. Thompson 905-803-8066 Canada 9
6. On the right hand side, please scroll down the list and think about how you might<br />
use the band widths that are listed and the physiological variables that can be<br />
measured. Think about why we would have entered this particular choice of band<br />
widths for you to get started with.<br />
Imagine, for example, that you have an adolescent client with ADHD and<br />
Anxiety. That this client demonstrated marked eye blink artefact that<br />
interfered with readings of 3 to 5 Hz but that this particular client also<br />
tuned out in 6-10 Hz (you find this out by having them increase then<br />
reduce different band widths using the ‘F’ screens that you will see in the<br />
next section ‘B’.) You would then use the 6-10 band width. Perhaps, with<br />
anxiety, 13-16 was too low and 19-22 too high. Perhaps in your<br />
assessment you found beta spindles at say 28 Hz which corresponded to<br />
negative ruminating. Then you would be using bandwidths that covered<br />
these areas. With anxiety perhaps you would have found doing a stress<br />
test that heart-rate variability and skin temperature reflected feeling<br />
stressed. Then you would be choosing screens that also showed these<br />
variables. When working with a young child who has ADHD you would<br />
want the mean magnitude of 3-7 Hz, 12-15 Hz (SMR), EMG ‘noise’ (52-28<br />
Hz) and the theta/beta ratio to pop up at the end of each 3 minute segment<br />
of the session, for example. Our trainers hand graph these values in<br />
coloured ink to encourage the kids to improve each time. Adults often like<br />
to make their own graphs. We find doing it by hand is better than doing it<br />
by computer.<br />
Scrolling down and familiarizing yourself with the list is extremely important.<br />
B. Becoming Familiar with the ‘Starting’ Array of Display Screens<br />
Available for each Channel Set:<br />
It is much easier and nicer if you attach a second monitor before you boot up<br />
your computer. Desk tops need a special card inserted – see your computer<br />
store. On your laptop it attaches easily on the back. Then you go to “control<br />
panel – display - settings, and click on the #2 monitor. Then click ‘extend my<br />
windows desk top on to this monitor, click ‘apply’ and OK.<br />
7. Now go back to the figure under 2 above, click the PI MT 1EEG Physio-HRV<br />
FB.chs channel set on the LHS. Then, under ‘please select a channel set and then<br />
a screen category’ on the RHS, select ‘all categories’ and then scroll down the<br />
list of screens.<br />
8. You can click on ‘picture view’ to get a cursory look a the screens but the screens<br />
will be much clearer to you if you choose the first 5 and click OK.<br />
Copyright ADD Centres Ltd. Prepublication – 1 st draft. Please do not copy. Dr. Thompson 905-803-8066 Canada 10
The above shows 2 EEG assessment screens. Only the single monitor screen on the<br />
left is essential. It should be included as your first screen during every feedback<br />
session no matter what the next four screen choices are. It allows you to double check<br />
that you still have a good EEG. Remember, “Garbage in is garbage out”.<br />
Two single monitor feedback screens. These are often used with children.<br />
Copyright ADD Centres Ltd. Prepublication – 1 st draft. Please do not copy. Dr. Thompson 905-803-8066 Canada 11
Trainer Screen<br />
Client Screen<br />
Example of 2 screens that might be adapted by you and used with adults. We have<br />
called these two “Universal” screens because by just holding down the mouse button<br />
and dragging you can make almost any screen you want using these screens. The<br />
trainer looks at the left hand screen with all the EEG bargraphs and all the<br />
physiological monitors while the client trains using the second monitor with just those<br />
variables that you (and they) have chosen. In the above example, in the client monitor<br />
on the right side, is an inhibit rectangle for 19-22 Hz and below it an enhance oval for<br />
11-12 Hz with a red rectangle at the base of the screen for the ratio 19-22/11-12 Hz.<br />
On the right side the inhibit rectangle is 23-35 Hz and the enhance oval below it is<br />
13-15 Hz and the ratio in purple at the bottom right of the screen is 23-35/13-15 Hz<br />
ratio.<br />
HOWEVER, since this is a “Universal” screen, you could change this screen and<br />
make it very simple and just have one variable on the second monitor.<br />
A Full descriptions of screens is given later (Starts on page 87).<br />
9. (Now you choose the next 5 and so on until you have looked at all the screens.)<br />
How to do your first session is describe below. Be sure to have your encoder<br />
attached and turned on. Choose a few statistics (you can do this under ‘options’<br />
when you are at the first display screen – you can choose different statistics when<br />
Copyright ADD Centres Ltd. Prepublication – 1 st draft. Please do not copy. Dr. Thompson 905-803-8066 Canada 12
you review this data later). Do your impedance check. Then try out each screen.<br />
Hit the green arrow to start (top of screen) then click on different screens by<br />
clicking the numbers 1 to 5. When you hit the square the EEG stops and the<br />
statistics pop up. Be sure to tell it to save some data so that you can look at<br />
everything later (first menu under ‘database’) without having to put on all the<br />
electrodes.<br />
ii. Starting a Client (Yourself)<br />
This is how we want our staff to begin with a new client<br />
and it is a good way for you to experiment with your new Infiniti instrument.<br />
Put electrodes on your own head and do the following.<br />
1. Open ‘Excel’<br />
This is not essential but if you have Microsoft Office we recommend you start this<br />
way and working with data will be faster, easier, and more visual.<br />
• Make a folder for Client Excel files<br />
• Use “Sheet 1” for the day to day examples of feedback statistics that are saved<br />
(samples without muscle or movement artefact)<br />
• Use “Sheet 2” for an example with all statistics taken at the initial assessment<br />
and every 5 th training session. (1-5-10-15-20-25-30-35-40) With this data you<br />
can make a number of graphs or histograms to show progression. With<br />
children where slow wave amplitudes are so much larger than fast waves you<br />
will want to make a separate progress graph for the slow and the fast waves.<br />
• Give this first file a client name (yours the first time).<br />
• Now just let Excel run in the background.<br />
• You will later be copying statistics that pop up at the end of each time<br />
segment you record (usually 3 to 5 minutes) on to this excel sheet. (Hold left mouse button<br />
down at upper left corner and pull it down to lower right corner and release. The statistics should<br />
be shaded. Hit ‘ctl C’ then at the bottom of the screen click excel and then click a square in excel<br />
work sheet and click ‘ctl V’ and the stats will be copied)<br />
• We suggest you just copy statistics from relatively artefact-free segments<br />
of data because you will be having excel graph this data to, hopefully,<br />
show progress both in individual training sessions and over several<br />
sessions.<br />
• Yes, you can tell the Infiniti program to “print” at the end of each segment<br />
of a session. The data will then be in Microsoft word which makes it easy<br />
to write notes. You can also review data from the Infiniti program<br />
“database” and do a trend report. Do try these things and make your own<br />
decision about which method or combination of methods works best for<br />
you. At our centre we used the Infiniti program Microsoft word option but<br />
found it was a bit cumbersome and took too much time. Excel was much<br />
faster. We tried the Infiniti graphing and it was reasonably fast but with<br />
children the difference in magnitude of theta waves compared to SMR or<br />
beta was so great that the graphing of fast waves was not sufficiently<br />
useful. We had to make two trend reports. Try it for yourself.<br />
• Our staff hand graph with the client and personalize the graph ‘scale’ to the<br />
client so the graph really shows how they are changing within the session.<br />
(See the appendix for some example graphs – you can print and use these.)<br />
Copyright ADD Centres Ltd. Prepublication – 1 st draft. Please do not copy. Dr. Thompson 905-803-8066 Canada 13
2. Begin a Training Session<br />
Please also see detail around page 30 “Staff Quick-Reference”<br />
i. Start Open Display Session<br />
• Enter your name and choose “Define New Session” then take these steps:<br />
1. On left side under your encoder name & channel set highlight the appropriate<br />
channel set: e.g., PI MT 1EEG-Physio-HRV FB.chs for the blue infinity.<br />
P+ MT 1EEG … for the grey box instrument, or P2 MT 1 EEG …for the<br />
procomp 2. You can choose the single Hz (called “2 Hz”) channel set for your<br />
first assessment. Choose the PI MT 1EEG-Physio-HRV FB.chs for feedback<br />
screens.<br />
2. On right side screens for that channel set will pop up (put mouse to top short vertical<br />
line (between ‘file name’ and ‘description’) and move it to right to expose more of<br />
the screen name). Choose _AA-1 assess and any 4 other screens by holding down the<br />
Ctrl and clicking over the ones you want. Release Ctrl and then say ‘OK’ (for<br />
children you usually start with “A” screens. For adults use screens that combine NFB<br />
+ BFB. (If you get the message “The number of detected encoders does not match<br />
with the channel set … then the encoder is not detected. Check that you have the right<br />
channel set, turned on your encoder, battery is OK, that the optical cable is inserted<br />
all the way in and the attachment to the computer is secure.)<br />
Now the ‘New Stuff’<br />
3. In the upper bar of the display screen click Options: Click statistics – go half way down (use<br />
mouse on right hand side vertical ribbon) and hold down the Ctrl key and click the MEANS<br />
that you want such as Delta-Theta, 3-10 Hz, Theta, SMR, Problem solving beta and further<br />
down the list: theta/beta, theta/SNR, or for adults, busybrain/SMR. (The first time we see a<br />
child we click the first mean, Delta, hold down shift and click the last mean, Busybrain/SMR.<br />
In this way all the means are highlighted.)<br />
4. Now, under “Options” click Impedance then push in the Infiniti blue button until the light<br />
flashes. Redo prep if they are not all green. Hold in button until light is steady to finish this.<br />
(If you forget to push in the button until a steady blue light is seen, the EEG will look like<br />
complete garbage!)<br />
5. Start with #1 the _AA assess screen. Now sit very still and look at one point. Click the green<br />
arrow to turn on the EEG for >40 seconds then click stop (red square) and stats pop up -<br />
write them down, shade them and copy to client’s excel sheet, or click ‘print’. As we<br />
noted above, “print” brings up the stats in word-for-windows from which you can save them<br />
and/or print them. However, we usually write them on a special graphing sheet that is also<br />
used for session notes (see appendix).<br />
6. We recommend you experiment with the excel sheet at this juncture.<br />
• Hold your left mouse button down over the top left corner of the list of statistics and draw<br />
the mouse down over to the lower right corner.<br />
• You see a dashed line ‘box’ appearing over the data and when you let the left mouse<br />
button up the data will all be shaded (the second time you do this just shade the numerical<br />
data because he names of the bandwidths will already be on the excel sheet from your<br />
first ‘pasting’.)<br />
Copyright ADD Centres Ltd. Prepublication – 1 st draft. Please do not copy. Dr. Thompson 905-803-8066 Canada 14
• Now hold down control and the letter ‘c’ (ctrl-c)<br />
• If you click alt-esc or you mouse click ‘excel’ on the bar at the bottom of your<br />
screen. Either way then the excel sheet you have running in the background will<br />
come up.<br />
• Hold down control and hit v (ctrl-v) and you will paste the statistics into the first column<br />
of the ‘excel’ sheet. Click ‘File’ and ‘Save’. The next set of statistics that pop up you will<br />
only highlight the stats themselves and then ctrl-c then paste them into the column<br />
immediately to the right of the last column of statistics means you have now got on the<br />
excel sheet.<br />
7. Now “save” the data and always write under Description the condition (eo, ec, task) and the<br />
electrode site(s) (e.g., Cz).<br />
8. You have now saved this “assessment” EEG data. (In actual client sessions, also save other<br />
samples where you feel there has been very little movement or muscle artefact. This is a good<br />
practice from time to time in order to review progress in the EEG in the light of electrode<br />
placements and enhance and inhibit band-widths.)<br />
9. When you are back in the display screens click ‘Edit – Edit VC Settings’. Go half way down<br />
until you see a list of band widths like 3-10Hz % time > C. C is short for constant. This will<br />
be the threshold for the % > threshold computations on some of the screens. Highlight the<br />
ones you have stats for one at a time and on the right change the default constant (a number)<br />
to the average, i.e., MEAN –for your client for that frequency band-width.<br />
Then do a save by clicking box below it. This saves it for that channel set for that client (your<br />
name in this case) for all time (but don’t click the second box at the bottom which would<br />
change the constant to original channel set for every client). You must run a feedback screen<br />
now and save some data for these ‘VC’ changes to % time >C to be remembered and<br />
automatically used in your next session.<br />
10. Continue your feedback session and you will see that in the ‘feedback’ screens that you chose<br />
the % > threshold boxes beside bargraphs on each screen are all running close to 50%. You<br />
should try to decrease the ones printed in red (inhibits such as theta) and increase the enhance<br />
ones which are printed in green. (Note: the bargraph threshold lines on the screen do NOT<br />
control % > C “thresholds.)<br />
11. You can change the on-screen thresholds either using your mouse over the threshold line’s<br />
end or by left clicking over the instrument (a red line appears outlining that bargraph) then<br />
going to the top above the display and clicking the ‘thr’ box and changing the number.<br />
NOTE again that this threshold # controls the points for that instrument and the sound and the<br />
display animation but NOT the %>threshold computation. (That you set a “C” constant for.)<br />
12. You can change the scale making it a larger range or a smaller range. You do this by clicking<br />
over the bargraph and then changing the number at the top of the screen.<br />
“Play” with the screens. Try different screens. If you have attached a<br />
second monitor then you can try out screens with the symbol ‘d’ and the<br />
‘F’ screens and the ‘universal’ screens.<br />
Copyright ADD Centres Ltd. Prepublication – 1 st draft. Please do not copy. Dr. Thompson 905-803-8066 Canada 15
II. A Way of “Picturing” the Program<br />
“Picture” the Infiniti program as a row of town houses. The program governs everything<br />
you can do in all of these dwellings, its like the electrical, heating and water system.<br />
Each house, however, is unique. (Each dwelling has its own family residing there.)<br />
Drawn by: Boyana Knezivic.<br />
Think of the town house basement as a channel set. It has a selection of EEG band<br />
widths and biofeedback measurements plus statistics for these variables. These band<br />
Copyright ADD Centres Ltd. Prepublication – 1 st draft. Please do not copy. Dr. Thompson 905-803-8066 Canada 16
widths were chosen by a senior clinician and coach in consultation with other<br />
professionals. They are sufficient in variety for you to get started. Then you can change<br />
them according to the individual needs of your client. (See some pictures under “Your<br />
first day” immediately following this.)<br />
Imagine that the first floor of the townhouse contains the program for changing all the<br />
screens (called the screen / script editor) that use the particular channel set in that house’s<br />
basement. Imagine that the second floor contains all the screens that work with this<br />
particular channel set and that you use to do your assessments and give training feedback.<br />
The first townhouse basement contains the channel set you will use most often called:<br />
PI MT 1EEG Physio-HRV FB.chs<br />
This contains the most frequently used band widths such as theta (4-8 Hz), SMR (13-15<br />
Hz), beta (15-18 Hz) and so on.<br />
It also contains commonly used ratios such as that used by Lubar and Monastra (4-<br />
8Hz) 2 x6.3/(13-21Hz) 2 x6.3 (The constant of 6.3 is cancelled out when doing a ratio)<br />
which is the theta/beta power ratio found in the literature for large studies of subjects who<br />
have ADHD. This appears to correspond to a division of ‘mean’ µv values squared but<br />
our A620 instruments give slightly higher values for theta and beta and for the ratios<br />
when compared with the Infiniti possibly due to different ‘windowing’. This is not truly<br />
‘power’ but it is termed this if you are using the Stoelting Autogenics A620 assessment<br />
output. These “power” ratios correspond reasonably well (but not precisely) to the mean<br />
band width µv values squared in the ratio we put on the assessment screen for the MT<br />
channel sets but as noted above the Infiniti ratios may be a little HIGHER than the ones<br />
you read in Monastra et al. They use a ‘cut off’ of 1.5 SD. If your ratio is within the age<br />
values given for 2 SD (2 standard deviations) in their report then you are well within their<br />
ranges for a diagnosis of ADHD.<br />
(Note: As a general statement, it would appear that if an older assessment<br />
and feedback program did not do either “rectification” or “windowing”<br />
(see discussion p. 147-150) that it would give higher values for<br />
bandwidths and for ratios (such as power of theta 4-8 Hz/ power of 13-21<br />
Hz. A newer program with “rectification” and “windowing” would give<br />
lower ratio values (particularly for children where the theta magnitude is<br />
relatively much higher) than the ratios published in the literature.)<br />
Copyright ADD Centres Ltd. Prepublication – 1 st draft. Please do not copy. Dr. Thompson 905-803-8066 Canada 17
Understanding “values” seen in Infiniti MT assessment<br />
screen:<br />
(Only ‘glance’ at this until you are very comfortable running sessions)<br />
This is easier if you understand the Appendix discussion on ‘magnitude’ (p. 147).<br />
In the MT Infiniti assessment screen you will notice that the pk-pk amplitudes in the<br />
EEG 2-40 Hz line graph and the coloured lines for pk-pk band widths (see below) are<br />
very much higher amplitude values than the “mean” values given numerically for<br />
different band widths and much much higher than the spectrum magnitude microvolt<br />
values seen on the spectrum at the bottom of the screen. The discussion on derivation of<br />
“power” values and then “magnitude” values from the raw EEG pk-pk values given in<br />
the appendix (p. 147) will help you see how the numerical values will change drastically<br />
depending on the unit-of-measurement that you have on the left hand ‘y’axis.<br />
The important thing, at this juncture, is to see that this screen allows you to compare the<br />
raw EEG to the spectrum. The spectrum is an average of the one second to the left of the<br />
end of the EEG in play or replay mode and to the left of the ‘red’ line in the review mode.<br />
This is really valuable for explaining the waves to a client. It is also valuable for you to<br />
see the relative magnitude of the different frequencies. The peak-to-peak line graph and,<br />
in the dual monitor assessment screens, the 3D spectrum really help you to see the bursts<br />
of energy in different frequencies over a time period.<br />
If you right click over the little numbers under the frequency bands (middle right side)<br />
you will see that these are means. Don’t get confused, these are the means for that band<br />
width up to the time you are at. In the screen below it is the mean to 5 seconds. You<br />
could change these in screen editor to be the ‘instantaneous’ peak-to-peak’ or peak-topeak<br />
+ damper values but we found these changed so quickly that just having a mean<br />
seemed to be more helpful. Experiment and make your own choice.<br />
“Raw” EEG<br />
wave<br />
On right<br />
side note<br />
“Mean” µv<br />
values<br />
Pk-Pk<br />
µv values<br />
Spectrum<br />
“Magnitude”<br />
µv values<br />
Copyright ADD Centres Ltd. Prepublication – 1 st draft. Please do not copy. Dr. Thompson 905-803-8066 Canada 18
The Raw EEG Wave<br />
When looking at the EEG remember that it is merely the sum of many different wave<br />
frequencies. Each frequency may be at a different amplitude. The whole wave may<br />
have electrical noise artefact. A simple way for you to begin to visualize this has been<br />
devised by Robert Thatcher and is shown below:<br />
3Hz at14µv<br />
6Hz at 10µv<br />
“Combined”<br />
10Hz at 10µv<br />
“Combined”<br />
14Hz at 6µv<br />
All the foregoing<br />
frequencies<br />
“Combined”<br />
All + 3µv Noise<br />
All +10µv Noise<br />
Try imagining more<br />
and more<br />
frequencies added<br />
to this and all<br />
changing amplitude<br />
with time.<br />
The above example was done using Neuroguide (Bob Thatcher)<br />
Most EEG software will do an FFT analysis of the complex EEG wave and then<br />
summarize the information contained in each ‘epoch’ (a time frame). It will then<br />
display this summary in the form of a spectrum that shows, for example, the average<br />
µv values (magnitude) for each frequency wave during a specified time. The time<br />
frame of one second is used for the MT assessment screen in the Infiniti program as<br />
shown in the figure above this.<br />
The next townhouse’s basement will contain a different channel set. It has been designed<br />
to do a different task. For example, in the ‘MT’ …. channel sets you might start the first<br />
assessment session with a new client using a 1 channel EEG 1Hz bins channel set (or the<br />
set misnamed ‘2 Hz’ bins which only uses the 1 Hz bins up to 29 Hz. Then it has 1 Hz<br />
bins for every other frequency. This gives it a little more room for important ratios.<br />
Copyright ADD Centres Ltd. Prepublication – 1 st draft. Please do not copy. Dr. Thompson 905-803-8066 Canada 19
Special Excel Assessment Summary<br />
(Skip this until you are very comfortable running sessions)<br />
The (misnamed) ‘2Hz’ bins channel set has an excel display sheet especially designed for<br />
it by Frank at Thought Technology. This excel sheet (MT Assessment Comparison 1 Hz<br />
Bin Report) may be found under Program Files-Thought Technology-Infiniti. Its special<br />
input C1, C2, C3, C4 (e.g., MT C4 Assessment 2 Hz Bin Mean) “containers” are found in<br />
the “Temp” file under “Infiniti”. It displays line graphs to compare 4 conditions or 4<br />
different times such as first assessment, 15 th session, 30 th session and post-training<br />
reassessment.<br />
You “export” data to this excel sheet by highlighting a session and just hitting “export<br />
data” (on right) then changing its channel set (left hand side below) to the “2 Hz bin”<br />
channel set if the data was taken in a different channel set. Then click “Session<br />
Statistics” and the “Save Export file as” box appears. Click the first line “MT C1<br />
Assessment 2Hz Bin Mean” and save. (Later you will click the C2 then C3 then C4)<br />
Answer “yes” to overwrite? Answer `close’ to channel settings and either accept or alter<br />
statistics (If you had marked statistics when recording and saving then these statistics are<br />
already highlighted but if you changed to a different channel set FOR THIS REPORT<br />
then you will have to highlight the statistics [all the means for the 1 H bins]the first time<br />
you enter, that is for ‘C1’ .)<br />
Copyright ADD Centres Ltd. Prepublication – 1 st draft. Please do not copy. Dr. Thompson 905-803-8066 Canada 20
Click OK and it will process the data. Now you do the same process for C2, C3, C4. Then<br />
you open the excel file and see<br />
:<br />
After you click “ enable automatic refresh” it will put on your new clients name and<br />
statistics for the 4 ‘conditions’. You must change the age and tell it what the conditions<br />
(eo,, ec,…) are or what times(1 st , 10 th ,..session) are for this client.<br />
This whole process is very fast and takes us only about a minute or so.<br />
Copyright ADD Centres Ltd. Prepublication – 1 st draft. Please do not copy. Dr. Thompson 905-803-8066 Canada 21
MT Channel Sets (quick overview)<br />
The pure 1 Hz bins assessment channel set is called:<br />
PI MT 1EEG Physio-1Hz bins.chs<br />
This channel set goes up to higher frequencies using 1 Hz bins.<br />
These channel sets are only used to do periodic assessments to see in detail which<br />
frequencies need to be enhanced or inhibited and, on reassessment, how training is<br />
effecting their magnitudes.<br />
The next townhouse may have a channel set which has been designed to do a 2 channel<br />
assessment in 1Hz bins so that you can compare sites (e.g., F3 to F4 in depression). It is<br />
called:<br />
PI MT 2EEG -1Hz bins.chs<br />
(note “2EEG” means 2 channels: 2 active electrodes on scalp sites, linked ear or<br />
common nose reference electrode, and a common ground electrode.)<br />
The next two townhouse basements contain channel sets that can be used for 2 channel<br />
training. The first has screens with bandwidths like the first townhouse which dealt with<br />
one channel training. It is called:<br />
PI MT 2EEG-Physio Feedback.chs<br />
The second has the same band widths but it specializes in coherence training. It is called:<br />
PI MT 2EEG-Coherence FB.chs<br />
Looking at Data Collected in One Channel Set using a Different<br />
Channel Set:<br />
This is a wonderful new feature but, because it is a little more advanced we advise that<br />
you skip this and come back to it later.<br />
Staying with our townhouse analogy, imagine how people (particularly children) love to<br />
explore and be creative and imagine that certain townhouses have ‘attics’ that are<br />
connected. The townhouses’ attics for those town houses that all used the same channels<br />
on their encoder, such as: A & B for EMG, C & D for EEG, E for EDR, F for<br />
Temperature, G for BVP and H for respiration, are connected. This means that the<br />
children can run their electric train through all these different house attics, that is, you can<br />
do a session with one of the house basement’s channel set and still be able to review<br />
that EEG data (in the interconnected attics) with a different channel set and the set of<br />
screens that belong to this different channel set. For example, I can do an EEG<br />
assessment and show the client some feedback screens quickly in their first interview<br />
using the regular feedback channel set: PI MT 1EEG Physio-HRV FB.<br />
Later, after the session is over, I can run the same data through the specialized 1 Hz bin<br />
or 2 Hz bin channel sets (1EEG-Physio 2Hz bins) that we use to remove artefacts from<br />
the EEG and look for ‘dips’ or ‘blips’ in the spectrum from 3 to 50 Hz that might<br />
correlate to the symptoms with which the client presented.<br />
Copyright ADD Centres Ltd. Prepublication – 1 st draft. Please do not copy. Dr. Thompson 905-803-8066 Canada 22
Below is an example of how to use data from one EEG session done with a feedback<br />
channel set to see the data displayed in single Hz bins.<br />
Below we have entered “Database”, selected a client and highlighted a session.<br />
Thus, in the above we started with ‘Database’ (upper left), chose a client and highlighted<br />
a session. In this example I chose a session on 6/15/2006 using the feedback channel set:<br />
PI MT 1EEG-Physio-HRV.chs. I clicked ‘review/report (lower right corner) and up<br />
came the Review/Replay Session confirm…box (upper right). I clicked “select channel<br />
set” upper left corner of that box, and the “Select Channel Set” box (lower left) popped<br />
up. I chose the PI MT 1EEG Hz bins.chs to review the data in 1 Hz bins (instead of the<br />
original feedback channel set ‘bins’ that had been used for data collection). (Remember,<br />
since you didn’t use this channel set to collect the data there will not be any statistics<br />
chosen. YOU MUST click ‘Options” and then click ‘Statistics’ and highlight all the<br />
means.) Click OK and select the top screen called ‘_AA -assess…’. When it appears on<br />
the screen I will remove the artefacts.<br />
When you are in the Assessment Display screen you highlight the statistics that pop up<br />
either at the end of a time period if you are running a session or when you click the<br />
‘calculator’ icon if you are just reviewing data using the assessment screen.<br />
Now hit ‘Ctl-C’ and copy these stats to an excel sheet saved for this client. We normally<br />
leave one or two free rows at the top to write in the date, site, and condition (eo, ec…). It<br />
is easiest to already have this excel sheet running in the background. Some of our young<br />
trainers always have that client’s excel sheet running in the background and they make<br />
beautiful graphs of progress. The kids love helping them with it.<br />
Copyright ADD Centres Ltd. Prepublication – 1 st draft. Please do not copy. Dr. Thompson 905-803-8066 Canada 23
Excel Sheet Running In The Background<br />
Copy the statistics that pop up after each segment of a session highlight statistics– hit ‘Ctl<br />
C’ –pull up the exel –hit ‘Ctl V’ to paste the stats in excel.<br />
Above figure shows statistics shaded. Then we hit Ctl-C.<br />
To make important statistics stand out, click the row number of the most important<br />
statistics for that client (might be theta for a child or high frequency beta for an adult) and<br />
then, on top right in the paint can icon, you select a colour and it will highlight that row<br />
in that colour. The client can then easily follow how that particular statistic is changing<br />
with time.<br />
Below is an Excel sheet with several rows highlighted. This was the first day. Each day<br />
more columns of figures would be added. After a period of time we could pick those days<br />
and those bandwidths and/or ratios that we would like to see in a graph. Then choose the<br />
type of graphic display we want and print this out for the chart. Below we chose the<br />
coloured lines. The client had huge eye blinks. In ‘1’ they were removed by artifacting. In<br />
‘3’ there were bursts of 20 Hz and 26 Hz spindling beta accompanied by feeling tense<br />
and a marked drop in 11-12 Hz alpha and 13-15 Hz SMR. Always ask “why” and look at<br />
the raw EEG if you see large changes like those shown in ‘3’ below.<br />
9<br />
8<br />
7<br />
6<br />
5<br />
4<br />
3<br />
2<br />
1<br />
0<br />
1 2 3 4 5<br />
C: 3-10Hz Mean<br />
(µV)<br />
C: SMR Mean<br />
(µV)<br />
C: 23-27Hz Mean<br />
(µV)<br />
C:Intensity/HiAlph<br />
a ratio Mean<br />
C:Busybrain/SMR<br />
ratio<br />
Mean<br />
Copyright ADD Centres Ltd. Prepublication – 1 st draft. Please do not copy. Dr. Thompson 905-803-8066 Canada 24
1. eo<br />
2. 3. 4.eo<br />
Band Width arifacted ec reading fdbk<br />
C: Delta-Theta Mean (µV) 2.96 6.74 3.93 4.43<br />
C: 3-10Hz Mean (µV) 3.2 8.2 6.2 7.6<br />
C: Theta Mean (µV) 2.75 4.65 4.26 5.03<br />
C: 5-7Hz Mean (µV) 1.55 3.28 1.82 3<br />
C: Thalpha Mean (µV) 3.45 4.7 3.05 4.25<br />
C: Low Alpha Mean (µV) 2.53 3.19 0.69 1.51<br />
C: High Alpha Mean (µV) 0.78 1.07 0.16 0.67<br />
C: 12-15Hz Mean (µV) 2.11 2.87 3.53 3.86<br />
C: SMR Mean (µV) 1.98 2.45 1.67 3.34<br />
C: 13-16Hz Mean (µV) 2.2 3.17 3.01 3.81<br />
C: Wide Beta Mean (µV) 3.56 6.62 5.36 5.24<br />
C: Prob-solving Mean (µV) 1.82 4.05 2.11 2.37<br />
C: Beta Mean (µV) 2.54 5.01 2.18 2.93<br />
C: Intensity Mean (µV) 1.78 3.85 1.17 1.97<br />
C: 23-27Hz Mean (µV) 2.3 2.86 3.02 3.11<br />
C: Busy-brain Mean (µV) 3.46 4.36 3.91 3.8<br />
C: 28-32Hz Mean (µV) 1.76 2.49 1.68 1.47<br />
C: Sheer Mean (µV) 0.88 1.15 0.73 0.86<br />
C: EMG noise Mean (µV) 0.97 1 0.73 0.73<br />
C: Theta Mean sq 7.55 21.58 18.12 25.26<br />
C: Wide Beta Mean sq 12.66 43.88 28.78 27.48<br />
C: Theta sq/WideBeta ratio Mean 0.6 0.49 0.63 0.92<br />
C:Delta-Theta/12-15 ratio Mean 1.4 2.35 1.11 1.15<br />
C:Delta-Theta/SMR ratio Mean 1.5 2.75 2.35 1.33<br />
C: Theta/Beta ratio Mean 1.08 0.93 1.95 1.72<br />
C:Thalpha/Beta ratio Mean 1.36 0.94 1.4 1.45<br />
C: LoAlpha/5-7Hz ratio Mean 1.63 0.98 0.38 0.5<br />
C: Prob-solving/SMR ratio Mean 0.92 1.65 1.26 0.71<br />
C:Intensity/Thalpha ratio Mean 0.51 0.82 0.38 0.46<br />
C:Intensity/HiAlpha ratio Mean 2.29 3.61 7.27 2.95 Beta Spindling in D<br />
C:Intensity/SMR ratio Mean 0.9 1.57 0.7 0.59<br />
:Busy-brain/SMR ratio Mean 1.75 1.78 2.34 1.14 down when relaxed<br />
In excel we can easily form any graphic display we wish for any of the variables. These<br />
can then be graphically compared over a number of sessions.<br />
(Note: On-the-other-hand, you can, of course, when the statistics pop up, click ‘close’<br />
and ‘print’. In that case the Infiniti program will print these statistics in Word for<br />
Windows. However our staff have found that it is a bit faster and more versatile to paste<br />
the data into excel.) Try both and chose which works for you.<br />
Suggestion For Using the rest of this <strong>Guide</strong>:<br />
We suggest you print out PART 2: Quick Reference Sheet. Then many readers may wish<br />
to go directly to PART 5: Description of Selected Display Screens and begin running the<br />
program. From here the next most useful step may be to read PART 3: …..Editing<br />
Screens. Have Infiniti as you running as you read this guide.<br />
Copyright ADD Centres Ltd. Prepublication – 1 st draft. Please do not copy. Dr. Thompson 905-803-8066 Canada 25
PART 1<br />
MT CHANNEL SETS & DISPLAY<br />
SCREENS<br />
Objective: To assist the readers to familiarize themselves with the concept of channel<br />
set, the important details of the comprehensive MT channel sets, and the logic of ordering<br />
a set of display screens to meet the most common requirements of practitioners.<br />
In a Little More Detail:<br />
‘MT’ Channel Sets<br />
The channel sets used in this group of screens comprise:<br />
(1) for initial assessments, channel sets for one channel EEG with 1 Hz bins:<br />
PI MT 1EEG Physio-1Hz bins.chs<br />
(You have 2 versions of this – one of them has fewer ratios. You also have an older<br />
version misnamed 1EEG-Physio 2Hz bins.chs which is really 1 Hz bins. It has a<br />
beautiful excel report sheet (described above) that data can be quickly ‘exported’ to – try<br />
it out.) Remember, it doesn’t matter which one you use to record data. You can highlight<br />
that session then change channel set to review data – also described above.)<br />
Quick Review of Special Excel Summary<br />
In ‘database’ from the first screen, click client name on left, click the first session you<br />
want in the comparison, click ‘Export Data’ on the right. Then click MT C1<br />
Assessement 2 Hz bin mean. If this doesn’t come up like this the first time just go<br />
opposite ‘Save in’ and browse and find: Programs, Thought tech, Infiniti, Temp. Note<br />
that Temp is seen in the example above. (This special excel sheet was created by Frank<br />
at TT. It takes 4 entries called C1,C2, C3, C4 for conditions 1-4. Click ‘save’, yes (to<br />
overwrite old stuff), ‘close’ on edit channels, then do set statistics that you want if they<br />
are different from the ones recorded and saved in the session. (Otherwise just click OK,<br />
Copyright ADD Centres Ltd. Prepublication – 1 st draft. Please do not copy. Dr. Thompson 905-803-8066 Canada 26
and the computer computes. Go through all these steps (takes 10 seconds) after clicking<br />
the second session that you want to have in the comparison. It could be that you do: eo,<br />
ec, reading and math. On the other hand you might be doing: initial assessment, 15, 30,<br />
40 th sessions to look for progress. We decided to only have 4 files compared because<br />
any more columns of stats and lines on a graph becomes too confusing and most people<br />
just don’t have the time to look at complex data output. If you want a line graph across<br />
all sessions just use excel as described previously.<br />
• The equivalent two channel EEG with 1 Hz bins (PI MT 2EEG -1Hz bins.chs)<br />
thus For 2 channel assessments use the two channel EEG + <strong>Bio</strong>feedback (BFB)<br />
measures and basic statistics called:<br />
PI MT 2EEG 1Hz bins.chs<br />
(2) For quick 1 channel assessments (done each session), feedback training, coherence<br />
(and later comodulation) training, and a script for a stress assessment (require 9 ‘color’<br />
and 3 stress assessment screens) you will use the feedback channel set called:<br />
PI MT 1EEG Physio-HRV FB.chs channel set.<br />
This channel set works well for<br />
one channel EEG + <strong>Bio</strong>feedback (BFB) measures, feedback and complex statistics.<br />
The Channel Sets in More Detail<br />
(1.) There are two, one channel 1 Hz bin Assessment Channel<br />
Sets for Assessment<br />
Named: PI MT 1EEG Physio-1Hz bins.chs<br />
PI MT 1EEG Physio-2Hz bins.chs<br />
The ‘bins’ allow the clinician/trainer to see at a glance the areas where the client/student<br />
has either a marked increase or decrease in magnitude (average amplitude, measured in<br />
microvolts).<br />
The Main ‘bins’ in the so-called ‘2 Hz’ Channel Set are:<br />
1.For Infiniti 2. 3. 4. 5. 6. 7.<br />
A Myoscan<br />
B Myoscan<br />
C EEG<br />
D EEG<br />
E SC<br />
F Temp<br />
G HR/BVP<br />
H Resp<br />
2-3<br />
3-4<br />
4-5<br />
5-6<br />
6-7<br />
7-8<br />
8-9<br />
9-10<br />
10-11<br />
11-12<br />
12-13<br />
13-14<br />
14-15<br />
15-16<br />
16-17<br />
17-18<br />
18-19<br />
19-20<br />
20-21<br />
21-22<br />
22-23<br />
23-24<br />
24-25<br />
25-26<br />
26-27<br />
27-28<br />
29-30<br />
31-32<br />
33-34<br />
35-36<br />
37-38<br />
39-40<br />
41-42<br />
43-44<br />
45-46<br />
47-48<br />
3-5<br />
3-7<br />
4-8<br />
8-10<br />
11-12<br />
13-15<br />
13-21<br />
15-18<br />
16-20<br />
19-22<br />
23-27<br />
23-35<br />
28-32<br />
32-36<br />
38-42<br />
44-48<br />
52-58<br />
Means<br />
Standard Deviations<br />
(4-8) 2 /(13-21) 2<br />
3-7/13-5<br />
4-8/13-15<br />
4-8/16-20<br />
6-10/16-20<br />
19-22/11-12<br />
23-35/13-15<br />
Note 1:<br />
Copyright ADD Centres Ltd. Prepublication – 1 st draft. Please do not copy. Dr. Thompson 905-803-8066 Canada 27
Column 1. are BFB variables<br />
Columns 2., 3., 4., & 5. are 1 Hz bins. These are used to get a precise view of what<br />
frequency is high or low.<br />
Columns 6. & 7. contain typical ranges used in feedback sessions and therefore are useful<br />
for trend reports.<br />
Column 8. contains useful ratios<br />
Note 2: This channel set can calculate for statistics the means and % of total power for<br />
all the forgoing variables.<br />
Note 3: The reason there is not overlap on the higher frequency bands and no standard<br />
deviations available (they are available in the feedback channel set) in this channel set for<br />
each bandwidth is that there is a severe limitation of 254 channels available and all the<br />
channels that are included could not have been included if we were to do all variations of<br />
statistics on each channel. This channel set has been designed to help you pinpoint<br />
frequencies that are very high or very low and follow the changes in these with training.<br />
Note 4. To design a 1Hz bin channel set for 2 channel assessments we have to leave out<br />
ratios, typical ranges used in NFB and the % of total power in order to fit in 36 one Hz<br />
bin band widths for both channel A and channel B.<br />
The Main ‘bins’ in the 1Hz Channel Set are:<br />
1.For 2. 3. 4. 5. 6. 7.<br />
Infiniti<br />
A Myoscan<br />
B Myoscan<br />
C EEG<br />
D EEG<br />
E SC<br />
F Temp<br />
G HR/BVP<br />
H Resp<br />
2-3<br />
3-4<br />
4-5<br />
5-6<br />
6-7<br />
7-8<br />
8-9<br />
9-10<br />
10-11<br />
11-12<br />
12-13<br />
13-14<br />
14-15<br />
15-16<br />
16-17<br />
17-18<br />
18-19<br />
19-20<br />
20-21<br />
21-22<br />
22-23<br />
23-24<br />
24-25<br />
25-26<br />
26-27<br />
27-28<br />
28-29<br />
29-30<br />
30-31<br />
31-32<br />
32-33<br />
33-34<br />
34-35<br />
35-36<br />
36-37<br />
37-38<br />
38-39<br />
39-40<br />
40-41<br />
41-42<br />
42-43<br />
43-44<br />
44-45<br />
45-46<br />
46-47<br />
47-48<br />
Band<br />
widths<br />
%s of<br />
total<br />
power<br />
Means<br />
Standard<br />
Deviations<br />
(4-8) 2 /(13-21) 2<br />
3-7/13-5<br />
4-8/13-15<br />
4-8/16-20<br />
6-10/16-20<br />
19-22/11-12<br />
23-35/13-15<br />
Copyright ADD Centres Ltd. Prepublication – 1 st draft. Please do not copy. Dr. Thompson 905-803-8066 Canada 28
(2.) The one channel Basic Feedback Channel Set<br />
Named: PI MT 1EEG-Physio-HRV FB.chs<br />
The virtual channel EEG frequency ‘bins’ in this channel set allow the clinician/trainer to<br />
train the most common band widths in use by experienced NFB clinicians without having<br />
to alter the channel set. Experienced clinicians will still want to make a special bandwidth<br />
(e.g., 14-15 Hz) for clients who show a significant rise or dip in magnitude only at a<br />
specific narrow frequency band.<br />
This channel set also has virtual channels that allow the trainer to simultaneously, with<br />
EEG biofeedback, train other biofeedback parameters including: respiration (R) & pulse<br />
(P) (heart rate variability with respiration, which is RSA or respiratory sinus arrhythmia),<br />
electrodermal response (EDR), peripheral skin temperature, and muscle tension with the<br />
electromyogram (EMG).<br />
The Main EEG ‘bins’ in the Basic Feedback Channel Set:<br />
Note that the names are idiosyncratic and just used for ‘descriptive’ purposes. For<br />
example, ‘2-4 Hz’ includes both delta and low theta, however it is clinically more useful<br />
as an inhibit channel width for alpha-theta therapy than 2-3 Hz delta. Some channel bins<br />
are identified only by numbers. The name of the ‘bin’ does not change, it remains<br />
constant through the remainder of the virtual channels that use that bin for such things as<br />
%>C, damper, means, standard deviations etc., in the rest of the channel set. Therefore, if<br />
you are changing a ‘bin’s’ frequency range (e.g., 13-15 to 14-15 Hz) we suggest that you<br />
change only named (not numbered) bins. In this way you will avoid the confusion of a<br />
bin name describing the wrong frequency range (e.g., changing 3-10 to 3-9 is confusing<br />
when you set statistics and only the name 3-10 Hz mean appears in the list. If, on the<br />
other hand, you changed thalpha 6-10 Hz to thalpha 5-9 Hz then when you see thalpha<br />
mean on the list for statistics you will have made a note that thalpha now means 5-9 Hz<br />
for that client (or for the channel set and all clients if that is what you choose). The<br />
number of channel widths available is limited so choices have been made as to which<br />
band widths are included in this basic set. These choices are based on the literature and<br />
clinical experience.<br />
1. Infiniti<br />
BFB<br />
A Myoscan<br />
B Myoscan<br />
C EEG<br />
D EEG<br />
E SC<br />
F Temp<br />
G HR/BVP<br />
H Resp<br />
2-40 Hz<br />
narrow<br />
Inhibit<br />
Hz<br />
2-4 ‘delta’<br />
3-7 deltatheta<br />
4-8 theta<br />
5-7<br />
3-10<br />
6-10 thalpha<br />
8-10 lowalpha<br />
Enhance<br />
Hz<br />
11-12 high-alpha<br />
12-15<br />
13-15 SMR<br />
(13-16)<br />
15-18 problem<br />
solving beta<br />
16-20 beta<br />
13-21 wide-beta<br />
38-42 Sheer<br />
Inhibit<br />
Hz<br />
19-22 intensity<br />
23-27<br />
23-35 busybrain<br />
28-32<br />
52-58 EMG<br />
noise<br />
( ) =may be<br />
left out so<br />
HRV can be<br />
entered<br />
Ratios<br />
(Theta) 2 /(widebeta)<br />
2<br />
Delta-Theta/SMR<br />
Delta-Theta/12-15<br />
Theta/Beta<br />
Thalpha/Beta<br />
Low-Alpha / 5-7Hz<br />
15-18/13-15<br />
Intensity/thalpha<br />
Intensity/hi-alpha<br />
Intensity/SMR<br />
Busy-brain/SMR<br />
Copyright ADD Centres Ltd. Prepublication – 1 st draft. Please do not copy. Dr. Thompson 905-803-8066 Canada 29
For this Channel Set:<br />
Note 1. We have tried to include the most commonly used bandwidths and ratios used<br />
for NFB plus a few ratios that may help you follow client progress.<br />
Note 2. For each bandwidth there is % of total power, a damper, pk-pk +damper (for<br />
controlling speed of feedback) and statistics, namely: means, %>C (to set % time<br />
>threshold constants), standard deviations, variability. The damper is used to slow<br />
down movement of bargraphs so the client can follow them more comfortably.<br />
Note 3. For each of the BFB variables there is: max, min, mean, SD, variation coefficient<br />
(variability).<br />
Note 4. The 2 channel NFB channel set has to include the major band widths and ratios<br />
but omit some of the other variables due to the 254 channel limitation.<br />
Objectives<br />
Our objectives in providing these display screens are:<br />
(1) to give clinicians a range of displays applicable to young children, adolescents and<br />
adults<br />
(2) to give Experts basic screens they can modify to meet very specific requirements for<br />
individual clients<br />
(3) to offer trainers who are beginning a NFB practice a sufficient variety of screens to<br />
cover the most common training needs of their clients<br />
Screen Complexity<br />
Note: Some trainers will correctly say that there are too many ‘instruments’ on most of<br />
these screens. The answer to this is as follows:<br />
(1) Many clients want a lot of information and want to make their own choice about<br />
which of the instruments (bargraphs etc.) they follow in any section of their<br />
training session. Our experience with a widely used two monitor (client and<br />
clinician) feedback system has repeatedly demonstrated that even young children<br />
often find the clinician screen much more interesting than the games on the client<br />
screen. Some even follow the raw EEG, which gives them instantaneous, accurate<br />
feedback. The “universal” group of screens will meet this need by allowing the<br />
trainer to put on the client monitor that which is most helpful (and desired) by the<br />
client.<br />
(2) When the client or the trainer wants to eliminate information from a screen this is<br />
easily and rapidly done by clicking on View and Hide and click on the instruments<br />
you want hidden(see Appendix). Alternatively the trainer can click on ‘edit<br />
screens’. The trainer then right clicks on each of the instruments that are to be<br />
deleted and deletes them. Then the trainer clicks on file and save as and gives the<br />
screen a NEW NAME. In this way the original screen is not lost.<br />
(3) In this program it is much easier to eliminate unwanted material than it is to build<br />
screens from scratch. Therefore we have attempted to give you as much<br />
information as possible and let the user delete that which is not needed as they<br />
customize screens for clients. We have also provided a “Universal” screen. This<br />
Copyright ADD Centres Ltd. Prepublication – 1 st draft. Please do not copy. Dr. Thompson 905-803-8066 Canada 30
screen is used to make feedback screens without having to know how to connect<br />
all the linkages and counters.<br />
(4) The dual screen option and in particular the UNIVERSAL screen is provided so that<br />
you can easily eliminate a great deal of information from the client screen but still<br />
have it available on the clinician screen. (See Part 5 for examples.)<br />
Terms Used in Display Screen Names<br />
Focus means singular external focus (15-18 Hz beta) in contrast to ‘open-awareness’<br />
(often at 11-12 Hz alpha) which is associated with a broad external awareness of<br />
everything around a person – a readiness state as may be seen in very high level athletes.<br />
(This is similar to, but not quite the same as, ‘open-focus’ a term coined by Les Fehmi. It<br />
is also probable that the EEG band width evoked would also be similar.)<br />
Animations refers to the “games” that change as the client meets criteria. These are easily<br />
changed using screen editor so only a small number are used in this initial screen set.<br />
Practitioners can substitute other animations as they wish. Each time you change the<br />
animation we suggest you “save-as-new” and give the screen a new name; i.e., change<br />
the animation part of the screen name and change the ending of the screen’s number.<br />
(For example: A1.3 is a darts display. If you changed it to ‘biplane’ then you could<br />
change the number to A1.31 -in this way you will know later which screen it was derived<br />
from.) Animation movement is linked to satisfying whatever criteria is set by the<br />
threshold. The trainer can change the threshold setting on the display screen during the<br />
feedback session. (Special Note: On the ‘Universal’ screens the animation and “points<br />
for all” are linked to meeting all the inhibit and enhance criteria. Therefore the trainer<br />
merely chooses which criteria are not to be emphasized and puts the threshold lines for<br />
these instruments in a position that makes it very easy for the client to always meet that<br />
criterion. Thus only the criteria you wish the client to control are working.)<br />
EMG noise inhibit is on all screens<br />
Points for holding all variables at the desired level for either 2 or 3 seconds is on all<br />
screens. (Time can be altered using the ‘linkage’ icon in screen editor.)<br />
The letter ‘d’. The capital letter (A, B, C…) plus a number e.g., A1, B2.1 when<br />
followed by ‘d’ means a dual monitor display has been made for that feedback display<br />
screen.<br />
The letters ‘LB’ mean left brain predominance in a task.<br />
The letters ‘RB’ mean right brain predominance in a task.<br />
Calm implies 13-15 Hz SMR<br />
Task implies 15-18 Hz Beta<br />
Busy implies high frequency beta (may have beta spindling)<br />
Intensity implies a busy brain but also either extreme focus on a topic or anxiety.<br />
Copyright ADD Centres Ltd. Prepublication – 1 st draft. Please do not copy. Dr. Thompson 905-803-8066 Canada 31
‘%’ refers to % time-over-threshold where threshold is set by you as a constant (C) for<br />
that client after you choose a list of 5 screens and before you enter (or during) the actual<br />
feedback session. % time-over –threshold allows you and the client to instantly know<br />
how they are doing. Usually this ‘C’ is set to equal the initial mean for each bandwidth<br />
that is being used for training. In this way the client will be above threshold about 50% of<br />
the time in the first session and will improve on that in future sessions (decrease with<br />
inhibit and increase with enhance frequency bands).<br />
Points (pts) are a different measurement. First, they are rewards for sustaining a<br />
desirable mental state for a defined time period (a decrease in variability). This is set at 2<br />
or 3 seconds for most screens but can be changed in the screen editor. Points, unlike the<br />
%-over-threshold measure, are linked to where the trainer places or moves the threshold<br />
on the display screen when doing the feedback session. (Note again that the %-overthreshold<br />
measurement is not dependent on where the threshold line is placed on the<br />
feedback screen during the session.)<br />
Measurements<br />
Note that there are three useful measurements for defining progress during a session and<br />
for looking at trends over time. These are: average microvolt amplitude values<br />
(magnitude), % time-over-threshold scores and points. They are all quite different. For<br />
example, a brief very high amplitude of theta (e.g., a brief electrode ‘pop’) during an<br />
unartifacted training segment of 3 minutes would have no discernable effect on either<br />
points or %-over-threshold but might make a large difference in mean theta magnitude.<br />
In another situation, if gaining a point was set for maintaining a desirable state for 3<br />
seconds a client could make a significant improvement in both their mean magnitude in<br />
microvolts for a 3 minute session segment and their %-over-threshold scores but show no<br />
points at all simply because they may have held the desired state for 2 or 2.5 seconds<br />
repeatedly but never made it to 3 seconds.<br />
We graph these measurements with the client. The sheets are staff use for this are<br />
included in the Appendix. Many of our adult clients and the mothers of some of our<br />
young clients like to make their own trend graphs using one or more of these measures<br />
plotted against session number or date. The third graph helps with this.<br />
Copyright ADD Centres Ltd. Prepublication – 1 st draft. Please do not copy. Dr. Thompson 905-803-8066 Canada 32
A Special Type of Training:<br />
Note that the damper setting makes a huge difference in how difficult it is to sustain a<br />
microvolt level for 3 seconds at a given threshold setting. Very little ‘dampening’<br />
(averaging or smoothing) makes the bargraph have wider excursions at a faster rate. An<br />
‘advanced’ trainer can rapidly change a damper setting in the Edit Virtual Channel<br />
Settings in order to make a threshold setting progressively more difficult to achieve and<br />
sustain. This type training of variability in the past has proved very successful in our<br />
centre using F1000 equipment made by Frank Diets.<br />
For example: First change the ‘time’ for receiving a point. Go to ‘Screen’ – edit screenclick<br />
on the chain link icon (just find it hidden under the points counter or under the<br />
animation. You know you have the right one when it has a time in seconds in the upper<br />
right hand corner. The time on most screens is either 2 or 3 seconds to get one point.<br />
Change this to 0.5 seconds and do a ‘save-as’ and rename the screen.<br />
In screen editor find ‘To All Points’ link.<br />
In example above it is set to ‘2 sec’. Change this to 0.5 and click ‘OK’<br />
Now, when running the program, change ‘damper’ in stages:<br />
Copyright ADD Centres Ltd. Prepublication – 1 st draft. Please do not copy. Dr. Thompson 905-803-8066 Canada 33
The above figure shows damper ‘time period’ of 5. Change it to2.5.<br />
1. Give 1 blue token for getting 40 points without ever pausing the feedback. Do the<br />
thresholds such that this takes the child about 10 minutes to achieve.<br />
2. Now your thresholds are set - don’t change them. Go into ‘edit’ – edit VC<br />
settings. Change the “damper” for the key bandwidth variable (say it is theta)<br />
from the default of ‘5’ to ‘2.5’. Give 1 blue token for getting 20 points without<br />
ever pausing the feedback.<br />
3. Again, go into ‘edit’ – edit VC settings. Change the “damper” for the key<br />
bandwidth variable (say it is theta) from ‘2.5’ to 1.2. Give 1 blue token for getting<br />
12 points without ever pausing the feedback.<br />
4. Again, go into ‘edit’ – edit VC settings. Change the “damper” for the key<br />
bandwidth variable (say it is theta) from ‘1.2’ to ‘0.6’. Give 1 WHITE token for<br />
every time they get 5 points without ever pausing the feedback.<br />
The very rapid feedback is both engaging and effective.<br />
Copyright ADD Centres Ltd. Prepublication – 1 st draft. Please do not copy. Dr. Thompson 905-803-8066 Canada 34
File Names<br />
In our latest version we have simplified and shortened the file names. Each name<br />
is preceded by a letter as explained above.<br />
Hold down Ctl and click to highlight each screen you wish to use.<br />
In the above figure we highlighted an assessment screen (we always do this) and 4<br />
feedback screens. One screen is called ‘damper’0.scr. This screen had its’ ‘damper’ set to<br />
0 for very fast feedback as we explained above. The screens set here are ‘A’ meaning<br />
SMR is one component of the feedback, and ‘B’ meaning that 15-18 Hz beta is one<br />
component of that screen’s (B2-1 Lightbulb.scr) feedback.<br />
Copyright ADD Centres Ltd. Prepublication – 1 st draft. Please do not copy. Dr. Thompson 905-803-8066 Canada 35
BASICS<br />
We have split the names into two parts so that you see under File Name:<br />
the animation, e.g., A1-3 Darts.scr<br />
and under Description:<br />
the remainder of the name, which includes the purpose and the band widths, e.g.,<br />
Calm Focus 3-7, 13-15, 52-58 Hz pts %-above threshold.<br />
In this way you can see the essential information about any screen at-a-glance.<br />
The name is comprised of several parts:<br />
• The letters and numbers define the essence of that screen. All of these screens can<br />
be used to “normalize” the EEG<br />
‘_AA’ will top the list because these are the assessment screens<br />
‘A’ are a set of screens for increasing calm through SMR 13-15 Hz<br />
training. (Think of Alert yet physically calm)<br />
‘B’ are a set of screens for increasing problem solving Beta 15-18 Hz.<br />
These are used in conjunction with tasks including learning and<br />
applying metacognitive strategies.<br />
‘C’ are screens for decreasing unproductive ‘busy-brain’ activity while<br />
increasing a state of Calm specific external focus or openawareness<br />
‘D’ are screens that emphasize reducing intensity (which may be anxiety)<br />
while increasing either open awareness OR a very calm state.<br />
(Think of Down-regulating intensity)<br />
‘E’ are screens that focus on the client’s ability to produce a combined<br />
mental state of calm open External awareness and readiness<br />
without interfering non-productive thoughts or anxious intensity.<br />
These screens have a wide range of uses from optimizing the<br />
performance of professional athletes, executives and advanced<br />
students to assisting clients who suffer from a number of disorders<br />
(e.g., panic, bipolar, migraine, asthma, etc) to gain self-regulatory<br />
control.<br />
‘F’ stands for “Flexibility” and “Feeling”. The client attempts to raise the<br />
given band width above threshold and hold it there and then put it<br />
below the threshold and hold it there. The client attempts to<br />
consciously understand the different metal states that raise and<br />
lower each band width. It is difficult but it is a major step in<br />
achieving ‘self-regulation’.<br />
Copyright ADD Centres Ltd. Prepublication – 1 st draft. Please do not copy. Dr. Thompson 905-803-8066 Canada 36
Some of these screens are complex and are used for optimizing<br />
performance. This can be for athletes, executives, senior students<br />
and even clients. For example, the client switches from calm open<br />
focus to intense specific focus and problem solving and back to a<br />
relaxed open state.<br />
‘H’ is for Heart Rate Variability (HRV) training.<br />
‘K’ These screens are used to develop a conscious self regulation of<br />
different mental states. The client must find a mental state that<br />
makes the boat and then a state that breaks the boat, i.e., increase<br />
the band amplitude ad decrease the band amplitude. (Think of K<br />
for Konscious). This is similar to ‘F’ screens but more interesting<br />
for children.<br />
‘M’ stands for “Modulation”. At this juncture the Coherence<br />
Training Screens have their own channel set and<br />
therefore are no longer under this heading. These screens<br />
use a channel set with 2 or more EEG channels. Thus at<br />
this time the coherence screens are with a separate MT<br />
channel set. Comodulation is not yet available.<br />
‘S’ are Special screens for specific programs<br />
• S1 is for Alpha / Theta work<br />
• S2 is for RSA and BFB (but a special screen is under “H”)<br />
‘T’ are Two EEG channel screens. The trainer will change the<br />
enhance and inhibit bands. These screens use their own<br />
MT channel set with 2 EEG channels.<br />
‘U’ are the “Universal” screen(s) that can be used to rapidly make most<br />
other screens in a dual monitor set up.<br />
Screens for Individual Clients<br />
At the ADD Centre, trainers use the letters ‘X’ for new attempts at child<br />
screens, ‘Y’ for new attempts at adult screens, & Z’ and the name<br />
of a client for individual clients for whom the trainer has made<br />
specific modifications on screens to satisfy that client’s needs.<br />
In this manner staff attempts at modifying screens will not get mixed into the<br />
original set.<br />
TIP: The trainer sets the threshold lines on the bargraphs. When the settings seem best<br />
for that client the trainer clicks screens, edit…, and in the screen editor clicks FILE and<br />
then save-as. The trainer now enters a new name: Z client’s name and the screen<br />
animation. Whenever this screen is called up it will always come up with the threshold<br />
lines at that client’s settings. Then points and the time to complete say a maze, is<br />
comparable from one day to the next for that screen for that client.<br />
Copyright ADD Centres Ltd. Prepublication – 1 st draft. Please do not copy. Dr. Thompson 905-803-8066 Canada 37
• In an ‘identifier’, A3-4 the number (# 3) is often used for screens that contain<br />
BFB.<br />
• the -4 means it is the fourth screen type (e.g., a different animation) in this set<br />
of screens. (You could make several more with minor variations on this basic<br />
screen and call them 3.41, 3.42, 3.43 etc.)<br />
• ‘d’ means that this is display is for a dual-monitor (client and clinician) system<br />
• WORDS such as ‘calmfocus’ give a general objective for the screen<br />
• ‘BFB’ means that there are biofeedback modalities on the feedback screen<br />
• ‘Mouse Walk’ just names the type of animation (this could also just be a raw EEG<br />
or one or two spectral displays).<br />
• ‘3-10’, for example, gives the specific inhibit frequency (THE ENHANCE<br />
frequency is the same for all the ‘A’ group of screens (SMR) and problem solving<br />
beta is the same for all the ‘B’ group of screens.<br />
• Already implied in the term BFB for biofeedback is the use of Respiration, Pulse,<br />
EDR, Temperature, Muscle EMG.<br />
Important Note re Sample Screens<br />
The screens below are only a sample of possible screens with a few site suggestions.<br />
However, the trainer must change the band widths listed and put in the appropriate bands<br />
and place the electrodes at the appropriate sites for each particular client as per their<br />
assessment EEG.<br />
Purpose of the Screen Names<br />
It is hoped that the initial letters and numbers with the animation name (balance beams,<br />
bags of gold, darts, bowling etc) will very rapidly allow the trainer to pick a group of 5<br />
appropriate screens for their client.<br />
Method for Naming Screens<br />
We have left out most of the animations (there are many different possibilities) in order<br />
to make the list of screens simpler for you to use when starting out. You can change the<br />
animation in ‘Edit’ very quickly and easily. Our trainers learn this (often from the<br />
children) in their first day of work. We have also not included all the listed scripts for<br />
assessment because we find it was too confusing for new people in the field. In version<br />
3.0 Thought Technology has made it possible to use the display screen data for trend<br />
reports. This is a great addition. However, as mentioned above, our staff has started to<br />
used excel for this purpose.<br />
PART 2<br />
THE INFINITI PROGRAM Quick-Reference<br />
The next two pages are in a smaller font so that they can be printed out on a single double<br />
-sided page and be used as a quick reference for your staff on how to run the program.<br />
Copyright ADD Centres Ltd. Prepublication – 1 st draft. Please do not copy. Dr. Thompson 905-803-8066 Canada 38
ADD Centre/<strong>Bio</strong>feedback Institute<br />
Staff Quick-Reference<br />
Objective: To assist centre staff to rapidly and effectively use the Infiniti NFB + BFB program.<br />
<strong>Instruments</strong>:<br />
1. Blue encoder box is the Infiniti. (The channel sets and screens start off with ‘PI’ then the name – you<br />
use the PI MT …… channel sets and screens)<br />
• Channels C & D are for the EEG (Channels A & B are for the EMG)<br />
2. Gray encoder box (like biograph) is the Procomp+ (The channel sets and screens start off with ‘P+’ then<br />
the name – you use the P+ MT …… channel sets and screens)<br />
• Channel A is for the EEG & Channel B is for the pulse! (until they change it to G)<br />
3. The tiny White box is the Procomp2. It is both encoder and differential amplifier. It does NOT require<br />
an EEG-Z triangular piece when channel A is used. It DOES require the EEG-Z differential<br />
amplifier when channel B is used. Only in channel B can you do impedances.<br />
• The channel sets and screens start off with ‘P2’ then the name – you use the P2 MT ……<br />
channel sets and screens. To check impedances use P2 MT EEGB with EEG-Z ).<br />
• Channel A (& B if you use a triangular EEG-Z) are for EEG (A has Resp, B has EMG)<br />
• Channel D & E are for biofeedback: Respiration or temperature etc.<br />
Starting a session: Use left mouse to click: INFINITI (on the windows screen)<br />
5. Start session (on the bar across top of screen) -Have client’s excel running in the background.<br />
6. Client’s name (note that under Database – Settings you have the option to make names confidential)<br />
7. Session Type: Script or Open Display then Session settings<br />
8. Choose Open Display (unless you have a special reason for using a script)<br />
9. On left side under channel set highlight the appropriate instrument and channel set: e.g., PI<br />
MT 1EEG-Physio-HRV FB.chs for the blue infinity, P+ MT 1EEG-Physio-HRV FB.chs …<br />
for the grey box instrument, or P2 MT 1EEG-RESP … for the procomp 2 little white box that<br />
clips to the client’s shoulder. Choose the ‘1 Hz’ or ‘so-called’ 2Hz channel set for your first<br />
assessment and for progress testing. Choose the PI MT 1EEG-Physio-HRV FB.chs for<br />
quick session assessment and feedback screens.<br />
10. On the right side screens for that channel set will pop up (if needed, put mouse to top<br />
short vertical line (between ‘file name’ and ‘description’) and move it to right to expose more<br />
of the screen name) - choose assessment and any 4 other screens by holding down the Ctrl<br />
and clicking over the ones you want. Release Ctrl and then say ‘OK’ (for adults use a<br />
“monitoring” screen (can have 19-22 or 3-10 Hz) – (If you get the message “The number of<br />
detected encoders does not match with the channel set … then the encoder is not detected.<br />
Check that you have turned on your encoder, that the battery is OK, that the optical cable is<br />
inserted all the way in and the attachment to the computer is secure.)<br />
11. You now have the option to select a different order for the screens. We usually skip this.<br />
12. Now you have important options. You can set statistics and edit virtual channel settings.<br />
Click statistics – go half way down (use mouse on right hand side vertical ribbon) and hold down the<br />
Ctrl key and click the MEANS that you want such as Delta-theta, 3-10, theta, smr, problem solving<br />
beta and further down the list: theta/beta, theta/smr, or for adults, BusyBrain/smr (The first time we see<br />
a child we click the first mean, delta, hold down shift and click the last mean, BusyBrain/smr. This<br />
way all the means are highlighted.<br />
13. Click ok … and up come the 5 screens that you have chosen. Go to the assessment screen #<br />
(controls at the top of the screen) to look at the EEG. Ask the client to sit very still and look at one<br />
point. Click the green arrow to turn on the EEG for 30 seconds then click stop (red square) and stats<br />
pop up - write them down or ‘print’. Print brings up the stats in word-for-windows from which you<br />
can save them (temp file under Programs/TT/Infinity) and/or print them. We usually, however, have<br />
the client’s excel file running in the background and we copy the stat to this sheet. We also have the<br />
client graphing and session notes sheet that you can find in the Appendix.<br />
Copyright ADD Centres Ltd. Prepublication – 1 st draft. Please do not copy. Dr. Thompson 905-803-8066 Canada 39
14. Save this 30 second assessment and a few other longer period samples that seem to have had little<br />
artefact. You may want the director to look at one of these later. (This is a good practice from time to<br />
time in order to review the EEG in the light of electrode placements and enhance and inhibit bandwidths.)<br />
15. When you are back at the display screen you can enter ‘Edit’ to change channel settings or click<br />
‘Options’ to choose statistics. This time click ‘change channel set’ on left side box and go half way<br />
down and see a list of band widths % time > C. C is short for constant. This will be the threshold for<br />
the % time > threshold computations on some of the screens. Highlight the ones you have stats for one<br />
at a time. In the right hand column the preset constant (a number) pops up. – Change it to the average<br />
MEAN – that you wrote down for your client for that frequency band-width.<br />
Then do a save by clicking box below it (but don’t click the second box at the bottom which<br />
would change the constant to original channel set). Do this for each of the bands theta-delta,<br />
3-10, SMR, problem solving beta … then close. It will save it to your client’s name.<br />
16. Use your mouse to get back to the screens (or hit enter) and run any screens of the 5 you<br />
chose originally for this client (#s 1-5).<br />
17. You can change the threshold either using your mouse over the threshold line’s end or by<br />
left clicking over the instrument (a red line appears outlining that bargraph) then going to the<br />
top above the display and clicking the ‘thr’ box and changing the number. NOTE: THIS<br />
threshold # controls the points for that instrument and the sound and the display animation<br />
but NOT the %>threshold computation. (That you set a “C” constant for.)<br />
18. You can change the scale making it a larger range or a smaller range. You do this by<br />
clicking over the bargraph and then changing the number at the top of the screen.<br />
19. If you are looking at respiration and pulse change the time from the “5 second” default to 30<br />
seconds 0or to one minute at the top centre of the screen.<br />
20. Also, if you are looking at respiration and pulse, right click and check the automatic threshold.<br />
‘Unclick’ it after a few seconds. It allows the scale to be automatically set. In this manner the lines<br />
following pulse rate and respiration will be visible. You may have to do this again if the client changes<br />
their position. (Hold the plethysmograph still while the ‘automatic’ is on!!) You will still find that you<br />
must ‘fine-tune’ the scale at the top of the screen.<br />
21. Occasionally you will want to change the display. Click ‘screen’ then ‘edit’… and you will<br />
be in screen editor. Right click over any instrument you wish to change and a menu will appear. If you<br />
change the channel setting (band-width) on an inhibit or enhance bar graph then you must also rightclick<br />
the 0.00 which you use for % time >C and change its channel input. Remember to also click over<br />
the name above it to change the text of that name. If you change the animation remember to click over<br />
threshold settings in order to change such items as: frames per second, cycle (for repeating like a<br />
bowling game but not like a balance beam) and movement one way or both ways.<br />
22. Do NOT change the name of any instrument even though it looks absurd if you altered the<br />
band-width. (e.g., The name could be SMR (old program) or Enhance2 on the new MT Channel set)<br />
and you just altered the channel setting to problem-solving-beta, Enhance3.) The name of an<br />
instrument could just as well be “Tom, Dick, or Charlie” it is only a name but all the point counters<br />
and other instruments are attached to that original name.<br />
23. If you change a screen then ‘save-as-new” with a new name. If it is for a particular client<br />
put “z” then the client’s name (e.g., z Charles Bowling…) in front of it so it is completely separate<br />
from the original screens on the screen list.<br />
24. If you only want to eliminate a few instruments temporarily for a client then just click view<br />
and click the instruments you wish to hide.<br />
25. For some clients you may be training 2 sites. Prep both sites before you start. This makes it<br />
easy to just move the active electrode between the two sites. (e.g., For a child who is ADHD,<br />
impulsive, over-active and dyslexic you may begin the session at C4 (enhance SMR and the inhibit<br />
dominant slow wave) then for the middle third of the session switch to CP5 (enhance 14-17, inhibit<br />
dominant slow wave while reading) and then for end of the session switch back to C4.<br />
26. Advanced technique: change the speed of the bargraph. Change the points counter using<br />
screen editor link box from 2 seconds to 0.5 seconds. Run screen. When client gets 40 points without<br />
any pause, change the ‘damper’ in ‘edit-edit VC settings’ from 5 to 2.5. When client gets 20 points<br />
without any pause, change ‘damper’ to 1.2 & demand 12 pts then between 0.6 and 1 and get 5pts. 1 st 3<br />
get a blue, then every 5 without a pause gets a white token. (Rewards ‘priced’ in blue. 10 white = 1 blue)..<br />
Copyright ADD Centres Ltd. Prepublication – 1 st draft. Please do not copy. Dr. Thompson 905-803-8066 Canada 40
PART 3<br />
OVERVIEW OF THE INFINITI<br />
PROGRAM<br />
Table of Contents<br />
Section Area To Be Covered Page<br />
I. Overview of Infiniti<br />
4 Modules<br />
1. Channel Set<br />
2. Screen Editor<br />
3. Script Editor<br />
4. Infiniti Program<br />
II.<br />
III.<br />
Running the Infiniti Program<br />
Introduction (Channel Set Options)<br />
A. Lets Get Started<br />
B. Doing an Assessment<br />
C. Artifacting the EEG<br />
D. Starting Feedback<br />
Suggestions for Open Display screens to use<br />
Names of Bandwidths on Thompson Channel Set<br />
Using Means for Starting Thresholds<br />
Channel Set Options Revisited<br />
Set Your Thresholds<br />
Note Concerning Statistics<br />
SCREEN EDITOR: Changing a display screen from the Infinity<br />
program using ‘Edit Selected Screen in Screen Editor’<br />
IV.<br />
BACKING-UP Your Display Screens, Scripts and Data<br />
V. Other Useful Channel Sets and Screens<br />
VI.<br />
Appendix<br />
Notes Concerning Some Terms Used in Building Screens<br />
Recording Client Statistics<br />
Moving Client Files from One Computer to Another<br />
Hiding <strong>Instruments</strong><br />
Comodulation<br />
Two Channel Assessment and Training Screens<br />
Copyright ADD Centres Ltd. Prepublication – 1 st draft. Please do not copy. Dr. Thompson 905-803-8066 Canada 41
Section I. OVERVIEW OF INFINITI<br />
The Program<br />
There are 4 Modules. Normally you only use the Infiniti program.<br />
1. Channel Set<br />
• Already set in program (experts can make new ones with additional software). We<br />
recommend you use the MT channel sets. These were outlined in Part 1. above.<br />
• States what you can measure (band-widths e.g., 4-8, 13-15 etc.) without doing an<br />
‘edit’ of Virtual Channels.<br />
• Restricts what statistics you can do (same band-widths, means, SD etc.) You can look<br />
at ‘Part 1” above to see the MT channel sets.<br />
2. Screen Editor<br />
• Used to make Display Screens<br />
(Note: “Lite” editor only used to changes animations and sound)<br />
• Can be entered independently to build a completely new screen from either the main<br />
feedback program or from the replay of a session display screens in order to modify<br />
existing screens.<br />
• Editor Allows you to:<br />
• Make a screen<br />
• Change display instruments<br />
• Set thresholds<br />
• Change channels (band-widths) for a particular instrument on the screen.<br />
• However: You can NOT change virtual channel settings such as band width or<br />
damper or % time >C. These settings can only be changed from the main Infiniti<br />
application when starting a training or assessment session (see ‘Part 2. Quick<br />
Reference above).<br />
Notes concerning the Screen Editor:<br />
• It assumes that the screen will be on a 1024 x 768 setting (done through windowscontrol<br />
panel-display-settings). You can use other settings but then you may want<br />
to adjust the instrument size for various screens using the screen editor (Full).<br />
• You should always give a name that says if it is a one or two monitor screen (We<br />
use ‘d’ for dual monitor)<br />
• If you want to use 2 monitors with a desk-top computer you will have to get a<br />
special video card which allows for this. Most newer lap-tops allow for 2 monitors.<br />
This is found by clicking windows-control panel-display-settings)<br />
• You are not able to play any data through any screen that you are making.<br />
However, if you are editing from the main Infiniti program training screens then all<br />
you have to do is save and the program returns you to the training screen where you<br />
can run the session (or replay the session) and see how your changes are working.<br />
3. Script Editor<br />
Scripts:<br />
• Advantage: Scripts allow for consistent, session-to-session, recording exercises so<br />
that:<br />
• The same exercise is done each session (e.g., experimenting with mental<br />
set, academic exercise, listening)<br />
Copyright ADD Centres Ltd. Prepublication – 1 st draft. Please do not copy. Dr. Thompson 905-803-8066 Canada 42
• Trend reports are more valid for research (than doing different things every<br />
session)<br />
• Scripts comprise a series of display screens with instructions before each<br />
• You can change the screens<br />
• You can change the instructions<br />
• You can change the time for each section as desired<br />
• Statistics<br />
• Are built in according to what channel set is used for that particular<br />
script and the linegraphs that are on the screen or on a hidden monitor<br />
screen.<br />
• Disadvantage: You do not have the full array of statistics that you can ask for with a<br />
display screen session. We therefore always do open display screen and often use the<br />
1 Hz channel set assessment.<br />
• Advantage: Statistics are calculated automatically for each section of your session<br />
and presented on a single report sheet.<br />
Note: Scripts can be made to assess and train the most common areas for NFB use:<br />
• ADHD (& adapt for Asperger’s & Seizures)<br />
• ADD + LD<br />
• Tense, Anxious, Ruminating + secondary inattention<br />
• Optimal Performance<br />
4. The Infiniti Main Application<br />
Introduction<br />
The Infiniti program is used for doing assessments and feedback<br />
• This is what you will usually be using to alter certain aspects of channel sets<br />
including band-widths (for the specific needs of an occasional client), dampening<br />
(like smoothing or averaging) and % time>C (a threshold constant)<br />
• It does impedance checks<br />
• It allows you to choose either:<br />
• A Script (series of display screens for a predefined purpose – e.g., a stress<br />
assessment)<br />
• A ‘set’ (called “Open Display”) – your choose 5 display screens for feedback<br />
to the client (statistics are only recorded if you check them off before entering<br />
training screens) (This may be increased in a later version of the program.)<br />
There is more than one set of display screens available for the Infinity program. Each<br />
different set of display screens is attached to its own particular channel set. An EEG<br />
recorded on one channel set can NOW IN VERSION 3 be played back on a different<br />
channel set. However for your own learning we still advise you to put electrodes and<br />
BFB sensors on yourself and record an EEG using every channel set and then replay<br />
some data in all your channel sets in order to test all available screens.<br />
Two of these channel sets are:<br />
1. Legacy Program: There is a set of display screens called the Legacy Suite. Some of<br />
these screens may be useful. These require a different channel set than the MT channel<br />
sets described in this guide.<br />
Copyright ADD Centres Ltd. Prepublication – 1 st draft. Please do not copy. Dr. Thompson 905-803-8066 Canada 43
2. Thompson Screens: PI MT 1EEG-Physio … channel sets: These channel sets are<br />
described in this guide. These channel sets have used all the virtual channels available in<br />
this program in order to give the practitioner the maximum degrees of freedom in<br />
choosing band-widths for feedback in conjunction with sensors for BFB. These channel<br />
sets allow you to do both assessments and feedback. These uses will be described below.<br />
We have attempted to take into consideration the common uses for NFB. As a NFB /<br />
BFB ‘generalist’ clinician you will most often be seeing:<br />
i. Children or Adults<br />
• ADHD (+ Asperger’s or + Seizure Disorder)<br />
• ADD (+ LD)<br />
These students do best if NFB is combined with metacognition<br />
ii. Adolescents & Adults<br />
• Ruminating, tense, anxious, + secondary inattention<br />
• Wish to Optimize Performance in academics, business and sports<br />
These clients all require cognitive strategies to assure that training ‘generalizes’<br />
to their every-day environment.<br />
The MT channel sets have taken into account the goals for training and matched them to<br />
the most common bandwidths and BFB modalities that are used for feedback (training)<br />
1 ST . Children or Adults (Below are suggestions for Cz training)<br />
• ADHD (+ Asperger’s or + Seizure Disorder)<br />
Impulsivity<br />
Emotional lability<br />
Hyperactivity<br />
(‘Firewall’ for seizure disorder)<br />
Attention Span (external )<br />
Activate inactive area by decreasing<br />
dominant slow wave (e.g., sensory<br />
aprosodia activate P4, T6)<br />
• ADD (+ LD)<br />
Concentration<br />
Activate brain area required for task (e.g.,<br />
Wenicke’s area for reading comprehension)<br />
<strong>Inc</strong>rease Attention Span (external) and<br />
‘activate’ inactive area.<br />
↑ SMR 13-15 Hz<br />
or<br />
12-15 Hz or<br />
13-16 Hz<br />
Decrease dominant<br />
slow wave or<br />
abnormal fast wave<br />
↓ Low Theta 3-7<br />
↓ Theta 4-8<br />
↓ High Theta 5-7<br />
↓ Thalpha 6-10<br />
↓ Low Alpha 8-10<br />
↓ Hi-Beta<br />
↑ Problem solving<br />
beta: 15 – 18 Hz<br />
(perhaps 38-42 Hz)<br />
↓ Theta &/or<br />
↓ Low Alpha &/or<br />
↓ Hi-Beta<br />
These students all require that NFB be combined with metacognition<br />
Copyright ADD Centres Ltd. Prepublication – 1 st draft. Please do not copy. Dr. Thompson 905-803-8066 Canada 44
2 nd . Adolescents & Adults<br />
• Ruminating, tense, anxious, + secondary inattention<br />
With most clients you may<br />
wish to produce a mental and<br />
physiological state which is:<br />
Relaxed<br />
Alert<br />
Calm<br />
The biofeedback (autonomic<br />
nervous system and muscle<br />
tension variables) and the EEG<br />
band widths to accomplish this<br />
are built into the display<br />
screens and scripts. They are:<br />
BFB – all modalities<br />
EDR<br />
BFB – all modalities<br />
+ ↑ SMR 13-15 Hz<br />
Openly Aware<br />
Decreased emotional intensity<br />
↑11-12 Hz hi-alpha<br />
↓ 19-22 Hz<br />
No unproductive<br />
Thoughts<br />
Ruminations<br />
↓ 23 –35 Hz<br />
Focused<br />
Productive<br />
Concentration<br />
↓ 3-10 Hz<br />
↑ 15-18 Hz<br />
• Wish to Optimize Performance – similar objectives and band width training<br />
to suggestions above for ruminating.<br />
For more detail we refer the reader to The Neurofeedback Book, Thompson and<br />
Thompson, 2003 (obtainable on the www.AAPB.org book store.<br />
You will note in Part 1 MT Channel Sets and Display Screens above that all of these<br />
bandwidths are covered in the screen designs.<br />
Copyright ADD Centres Ltd. Prepublication – 1 st draft. Please do not copy. Dr. Thompson 905-803-8066 Canada 45
Section II. RUNNING THE INFINITI<br />
MAIN APPLICATION<br />
A. Lets Get Started<br />
Start an excel sheet saved with this client’s name to a file for your client. Keep this excel<br />
sheet up and running in the background.<br />
The initial 10 steps to open the program are those that were listed in Part 2 Quick-<br />
Reference. They are repeated here and were as follows:<br />
Starting a session:<br />
Use left mouse to click: Starting a session: Use left mouse to click: INFINITI (on the windows<br />
screen)<br />
Starting a session: Use left mouse to click: INFINITI (on the windows screen)<br />
1. Start session (on the bar across top of screen)<br />
2. Client’s name (note that under Database – Settings you have the option to make names<br />
confidential)<br />
3. Session Type: Script or Open Display then Session settings<br />
4. Choose Open Display (unless you have a special reason for using a script)<br />
5. On left side under channel set highlight the appropriate instrument and channel set: e.g.,<br />
PI MT 1EEG-Physio-HRV FB.chs for the blue Infinity, P+ MT 1EEG-Physio-HRV<br />
FB.chs … for the grey box instrument, or P2 MT 1EEG-RESP … for the procomp 2 little<br />
white box that clips to the client’s shoulder. Choose the ‘2 Hz’ channel set for your first<br />
assessment and for progress testing. Choose the PI MT 1EEG-Physio-HRV FB.chs for<br />
quick session assessment and feedback screens.<br />
6. On the right side screens for that channel set will pop up (if needed, put mouse to top<br />
short vertical line (between ‘file name’ and ‘description’) and move it to right to expose<br />
more of the screen name) - choose assessment and any 4 other screens by holding down<br />
the Ctrl and clicking over the ones you want. Release Ctrl and then say ‘OK’ (for adults<br />
use a “monitoring” screen (can have 19-22 or 3-10 Hz) – (If you get the message “The<br />
number of detected encoders does not match with the channel set … then the encoder is<br />
not detected. Check that you have turned on your encoder, that the battery is OK, that the<br />
optical cable is inserted all the way in and the attachment to the computer is secure.)<br />
7. You now have the option to select a different order for the screens. We usually skip this.<br />
8. Now you have important options. You can set statistics and edit virtual channel settings.<br />
Click statistics – go half way down (use mouse on right hand side vertical ribbon) and<br />
hold down the Ctrl key and click the MEANS that you want such as Delta-theta, 3-10,<br />
theta, smr, problem solving beta and further down the list: theta/beta, theta/smr, or for<br />
adults, BusyBrain/smr (The first time we see a child we click the first mean, delta, hold<br />
down shift and click the last mean, BusyBrain/smr. This way all the means are<br />
highlighted.<br />
9. Click ok … and up come the 5 screens that you have chosen. Go to the assessment screen<br />
# (controls at the top of the screen) to look at the EEG. Ask the client to sit very still and<br />
look at one point. Click the green arrow to turn on the EEG for 30 seconds then click stop<br />
(red square) and stats pop up - write them down or ‘print’. Print brings up the stats in<br />
word-for-windows from which you can save them (temp file under Programs/TT/Infinity)<br />
and/or print them. We usually, however, have the client’s excel file running in the<br />
background and we copy the statistics to this sheet. We also have the client graphing and<br />
session notes sheet that you can find in the Appendix.<br />
Copyright ADD Centres Ltd. Prepublication – 1 st draft. Please do not copy. Dr. Thompson 905-803-8066 Canada 46
B. Doing an Assessment:<br />
a. EEG Assessment<br />
Objectives:<br />
1. To obtain statistics to:<br />
i. Demonstrate differences from expected normal EEG pattern for different<br />
frequencies and band-widths<br />
ii. Suggest what thresholds should be (mean for each band-width) for feedback<br />
instruments<br />
iii. Enable the practitioner to do pre and post training assessments to show<br />
changes<br />
2. To Teach Clients and Staff<br />
To be able to teach your client about how their EEG pattern (high or low<br />
amplitudes in different band-widths [e.g., theta or SMR etc] correspond to the<br />
actual EEG and to their mental state [focused, calm, etc.]<br />
Assessment, Artifacting, and Teaching Screen<br />
Goal:<br />
The Assessment screen has a threefold goal. First, to observe the raw EEG. Second, to<br />
remove artifacts in order to have accurate statistics. Third, to teach the client (&/or<br />
parents) which band-widths correspond to which mental states.<br />
Assessment Procedure:<br />
Initial and Progress Testing Assessments:<br />
In the initial assessment the trainer uses the assessment screen (which is shown below)<br />
while the client is carrying out each of the data collection conditions: eyes open (EO),<br />
eyes closed (EC), reading, and math. The trainer should watch the client carefully and hit<br />
the spacebar each time the client does anything that might produce an artifact such as<br />
moving or blinking. This will place a marker on the screen making the artifacting process<br />
both easier and more accurate. The trainer can do statistics separately for each condition.<br />
Using a Script<br />
We only recommend using a script to do stress assessments.<br />
However, under the original (old) channel set, we designed an assessment script: PI MT<br />
2Hz Bins Initial Assessment-Progress.prt (note that the ‘prt’ ending designates the script<br />
screens) which does one minute each for eo and ec and two minutes each for the tasks,<br />
reading and math. These times can easily be changed. (To do this by click on Edit Script<br />
Settings and highlight the task first in the Activity list and then in the Step List.) If you<br />
have our original disk, you can also use the PI MT 6Phy initial Assess-Progress.prt. This<br />
script uses an old version of the MT Channel sets. We felt that scripts for this purpose<br />
were cumbersome and it was easier to just do these conditions in open display using the<br />
new 1 Hz bin channel set. The new 3.0 and later versions of the program allow you to<br />
do all the statistics and trends using display screens. (In earlier versions you had to use a<br />
‘script’ to follow trends.)<br />
Copyright ADD Centres Ltd. Prepublication – 1 st draft. Please do not copy. Dr. Thompson 905-803-8066 Canada 47
Using the Open Display Screens (Our Preference)<br />
You can do a 1 Hz bin assessment using the Open Display screens:<br />
PI MT 1EEG Physio-1Hz bins.chs<br />
PI MT 1EEG Physio-2Hz bins.chs<br />
At the ADD Centre we also use PI MT 1EEG-Physio-HRV FB.chs channel set for<br />
repeated assessments to gage progress. The assessment screen is always one of the 5<br />
screens that we choose for a feedback session. It serves a number of purposes. We can<br />
save the data for future artifacting and, from time to time during a session, ensure that we<br />
have a good EEG being recorded. In addition, we can remind the client of how their EEG<br />
pattern reflects their mental state and the difficulties that they are trying to overcome.<br />
This is a reminder of their clinical or educational goals and what they want to accomplish<br />
in terms of changing their mental state and, thereby, the observed EEG. We remind them<br />
that the EEG is nothing more than a flag. A flag that reflects what their brain is doing at<br />
any instant in time. A flag that is a tool for them to use as a guide to help them practice<br />
sustaining mental states that will optimize their own performance.<br />
A single monitor and a dual monitor example of the 1 channel assessment screen are<br />
shown below:<br />
Copyright ADD Centres Ltd. Prepublication – 1 st draft. Please do not copy. Dr. Thompson 905-803-8066 Canada 48
aÉàxM g{x ÑÜÉzÜtÅ wÉxá ÇÉà átäx à{|á ~|Çw Éy Ñ|vàâÜxA gÉ átäx |à çÉâ vÄ|v~ à{x PrtSc ~xç ÉÇ à{x àÉÑ<br />
Ü|z{à {tÇw á|wx Éy çÉâÜ vÉÅÑâàxÜ ~xçuÉtÜwA j{tàxäxÜ |á ÉÇ à{x ávÜxxÇ tà à{tà ÅÉÅxÇà |á átäxw |Ç à{x<br />
j|ÇwÉãá vÄ|Ñ@uÉtÜwA lÉâ à{xÇ vÄ|v~ à{x ÑÜ|Çà |vÉÇ tà à{x àÉÑ Éy à{x ÑÜÉzÜtÅ ávÜxxÇ ;|à ÄÉÉ~á t u|à Ä|~x<br />
t ÑÜ|ÇàxÜ |y çÉâ ÄÉÉ~ tà à{x àÉÑ Éy à{|á y|zâÜx
which initially lies on the right hand side of the EEG linegraph. You can move it to the<br />
left and look at the spectrum magnitudes for any one second portion of the EEG.<br />
In addition, the average (to the number of seconds the display has been running) microvolt<br />
values for selected band widths and ratios is displayed, to the right of the 52-58 Hz<br />
linegraph, on the right hand side of the screen.<br />
Event Markers<br />
You can right-click and set an event marker as a dotted line. This enables you to write a<br />
note describing the event.<br />
• To see information for markers. Set the time frame to size to session. Then<br />
left click over any marker and the event description will pop-up. Then use<br />
alt-key and draw a small box at that point and you will see the event.<br />
However, it will not come up with a time scale. To get out of it you click on<br />
the circular arrow next to the calculator box in the upper right hand side of<br />
the screen.<br />
• We use event marking without writing a note to mark eye blinks and client<br />
movement when we are doing an assessment. This makes sure that you catch<br />
and eliminate all the artefacts before doing statistics.<br />
Removing Artefacts from the EEG:<br />
While reviewing the data the trainer can hold down Ctrl and left click while dragging the<br />
mouse across the data to mark a section that contains artifact. It turns grey when you<br />
release the mouse. When you click the calculator icon at the top of the screen the grey<br />
areas that mark artefacts will be excluded from the statistical calculations. (Important:<br />
Always click that calculator icon before you click print. If you forget to do this the<br />
statistics that you print will still include all the segments you thought you artifacted out.)<br />
The grey area is the area that you wish the program to ignore (no data is deleted) when<br />
statistics are calculated. The delete option for these grey highlighted areas only<br />
refers to ‘removing’ the artifact segment grey box.<br />
• Thus, the Infiniti program can ignore these sections that you have<br />
highlighted when you request statistics. If you right-click over the ones<br />
you don’t want to mark any more and choose delete rejection segment<br />
then the program just removes the grey highlighted box (i.e., There is no<br />
loss of data).<br />
Recording<br />
We usually have the client blink before recording and sit comfortably and still while we<br />
are recording. Most of the record, under these circumstances, may be artifact free.<br />
Nevertheless, as noted above, we always watch the client during the recording and click<br />
the space bar whenever there is movement or an eye-blink. This places a marker on the<br />
screen which helps you accurately identify artefacts. For details on Artefacting see The<br />
Neurofeedback Book (it can be obtained through www.AAPB.org).<br />
The 52-58 Hz EMG noise line below the EEG helps you distinguish muscle artefact from<br />
high beta neuronal activity. (52 Hz is above the desirable 39 - 41 Hz “Sheer rhythm”<br />
activity and will also avoid 50 Hz or 60 Hz electrical noise.<br />
Copyright ADD Centres Ltd. Prepublication – 1 st draft. Please do not copy. Dr. Thompson 905-803-8066 Canada 50
The spectral array will help the trainer distinguish low frequency movement artefact from<br />
3 Hz theta activity.<br />
Note: It is important to note again that the spectral array only reflects the one<br />
second of EEG activity to the left side of the red line.<br />
Teaching:<br />
Use the same _AA1 –1 Assess …. for teaching the client about the correspondence of<br />
band-width amplitudes to mental states. One of your most important objectives is to help<br />
your clients understand the EEG pattern and its possible meaning in terms of mental state<br />
changes. The spectral array and the microvolt boxes above it help you to do this. For<br />
example, in a child with ADHD you might observe very high amplitude slow wave<br />
activity around 3-5 Hz. The client, at these points, may be internally distracted and not<br />
attending to what you are saying or what they are supposed to be reading. If you have<br />
observed and marked the times when the client appeared to drift off (eyes may seem to<br />
‘glaze’ over) then this may confirm your observation and be helpful to parents or client in<br />
understanding the EEG. You may also observe that an impulsive client may have a dip in<br />
the EEG magnitudes between 13 and 15 Hz. This may reflect low sensorimotor (SMR)<br />
activity. On the other hand, in a highly stressed adult client whose inattention<br />
corresponds to them ruminating you might observe a marked peak (blip) in hi-beta<br />
activity somewhere between 23 and 34 Hz.<br />
You can observe these dips and blips in the record and suggest that your client<br />
experiment by trying to find mental states that would increase them and, alternatively,<br />
decrease them (use the ‘F’ screens or the ‘sailboat’ screens) so that they could identify for<br />
themselves the mental-state-meaning of these dips and blips in their record. The sailboat<br />
screen can be helpful in this regard. The example screen shown above taken from a<br />
marksman (small arms) was completely different when he made a good shot – none of<br />
the ‘dips’ or ‘blips’ noted above were present.<br />
Note: Key for ‘teaching’:<br />
We have designed the Thompson (MT) EEG assessment screens to have a large multiline<br />
graph just below the EEG. This allows you to do a click, drag and shade operation<br />
(hold down he shift key while dragging the mouse across the desired section of EEG).<br />
This will highlight a section of EEG. Then it asks if you would like to see statistics. In<br />
this program the only statistics it is capable of giving to you are those that are represented<br />
by linegraphs on the display screens. (We have also designed the assessment screen with<br />
dual monitors so that there can be a 3 d display and band width line graphs. This also<br />
allows more statistics to be observed when you highlight a section of EEG.) You answer<br />
‘yes’ and the program will now give you all the stats for bandwidths that we have<br />
inserted (or you insert) as linegraph band-widths on this screen and on the dual monitor<br />
screen (there is a limit to the number of line graphs the program will allow without<br />
crashing).<br />
Copyright ADD Centres Ltd. Prepublication – 1 st draft. Please do not copy. Dr. Thompson 905-803-8066 Canada 51
. Psychophysiological Stress Assessment<br />
(Note: Dr. Vietta Sue Wilson is designing and refining more sophisticated stress<br />
assessment screens for future use.)<br />
Objectives:<br />
1. To obtain statistics to demonstrate:<br />
• Differences from expected normal baseline values and changes with stress.<br />
• Degree of physiological recovery in a short time period following stress.<br />
2. To be able to teach clients about how their psychophysiological variables correspond<br />
to their mental state.<br />
Key: The screen we designed for the stress assessment review, R1-1 Stress Review<br />
BFB.scr allows the practitioner to review all segments of the stress assessment on a<br />
single screen (set the screen to 2 minutes) (right click over each line and click automatic<br />
to allow the lines to ‘auto-scale’ as you click the right arrow two or three times to allow<br />
the lines to find a suitable position. I usually click till I am near the end of the session and<br />
in that way the full excursion of respiration shows on the screen. All the lines should be<br />
seen for: EDR, Temp., EMG, BVP, and Resp. Now again right click each of the<br />
linegraphs and turn off the automatic scaling. This allows you to left click each line graph<br />
and re-scale it as needed. Now click the arrow to the left of the seconds box and highlight<br />
Size to Session. (Sometimes you will have to search for the best segment with autoscaling<br />
so that you get an excellent graphic display for the entire session.) The program<br />
also allows the practitioner to left click on the print icon and it will copy the statistics and<br />
the screen so that both you and your client can have a full colour copy of their responses.<br />
C. Starting Feedback - Open Display Screens<br />
At this juncture we suggest you look at Part 1 Channel Sets and Display Screens. At the<br />
end of that section is a preliminary list of screens. Review, in Part 1, the logic behind the<br />
names of the screens. This will assist you to choose 4 screens that will help with the<br />
client you are working with. At this point we suggest you review steps in Part 2 Quick<br />
Reference with electrodes on yourself and run the feedback program. In this manner you<br />
can try out most of the available screens and begin to make changes in them using the<br />
Screen and the Edit Screens option. To edit screens we refer you to Section III Screen<br />
Editor below.<br />
However, at the risk of being repetitive, there are a few points that deserve some<br />
repetition and elaboration. However the rest of this section really is repetitive and can be<br />
skipped if you are already moving easily through the program and changing the screens.<br />
Copyright ADD Centres Ltd. Prepublication – 1 st draft. Please do not copy. Dr. Thompson 905-803-8066 Canada 52
a. Trouble Shooting<br />
Battery Check<br />
Your instrument may not tell you when the battery is low. This is particularly true of the<br />
procomp2. You must find what is stopping the computer from detecting the encoder. The<br />
error message you get says, “The number of detected encoders does not match with the<br />
channel set …”. This means that the encoder is not detected. Check that you have turned<br />
on your encoder, that the battery is OK, that the optical cable is inserted all the way into<br />
both the encoder and the rectangular blue USB box. Also check that the USB attachment<br />
to the computer is inserted all the way (second only to a low battery this is the most<br />
common problem in our feedback systems).<br />
Channels List – Encoder not Detected Message:<br />
When the list of channels that are presently connected (A to H) comes up you will note<br />
that some of them have a number 1 in the right hand column. This is a constant and it<br />
merely indicates that it is not able to detect any sensor attached (plugged in) to that<br />
particular inlet. If you did put a sensor for that channel on to the client then something is<br />
wrong. Perhaps it is as simple as just reinserting the wire from the sensor to the encoder<br />
box more firmly. Perhaps your wires to the sensors are attached to the WRONG entry<br />
points – the ‘channel’ column tells you which sensor goes to which channel for the<br />
‘channel-set’ used and therefore for the screens you using in the program. Correct the<br />
attachments and make sure they are all firmly pressed into the encoder inlets and then and<br />
hit “repeat”. If the #1’s disappear for each of the channels you are using then everything<br />
is detected and you are ready to proceed. If not the problem may require that you replace<br />
a connecting wire (wires do break over time, especially when you are working with very<br />
active children) or even a preamp, an electrode or a sensor.<br />
Perhaps the most confusing problem is bad 10-20 paste. This can happen with a whole<br />
batch that has been frozen in transit. It may occur at the end of a jar that has sat around<br />
too long.<br />
We have had all of these problems. They occur with whatever companies machine we are<br />
using but, thankfully, less often when using Infiniti.<br />
Copyright ADD Centres Ltd. Prepublication – 1 st draft. Please do not copy. Dr. Thompson 905-803-8066 Canada 53
. Statistics, Impedances. Frequency Bands, Dampers<br />
…<br />
When your display screen first appears you will want to check the impedances of your<br />
electrode connections. One electrode with a very poor impedance will markedly alter the<br />
recording and the microvolt values of the recorded data. Experiment with this for<br />
yourself. Click ‘Options’ and check impedance.<br />
Now choose the statistics that you want to follow. Click ‘Options” and choose ‘means’,<br />
% time > C and any other statistics that you want to follow.<br />
In the above figure we have chosen to follow 5 means.<br />
Note they are about half way down the channel list.<br />
After you choose statistics, when you click the red box to stop a recording, the statistics<br />
for the segment that has just been recorded pops up. You decide whether or not to print<br />
these statistics (or copy them to excel), save the session, and tell the program to continue<br />
with another session.<br />
Thus it is at this juncture that we can click ‘Edit’ and:<br />
a. Check Impedances (You must be using an EEG-Z preamp)<br />
b. Change Channel Settings such as:<br />
• the band-widths for feedback for the rest of the session:<br />
• the “dampening” of feedback for different band-widths<br />
• the % > C, threshold level for different band-widths<br />
Copyright ADD Centres Ltd. Prepublication – 1 st draft. Please do not copy. Dr. Thompson 905-803-8066 Canada 54
c. OR click ‘Options’ and check off statistics before you start the feedback and,<br />
after you run feedback for a few minutes, to add any new statistics you<br />
forgot to put on the list before starting.<br />
Note:<br />
i. Always Check Impedance (In order to do this you must be using an EEG-Z<br />
preamp.)<br />
• If you are using the procomp/infiniti hold the start button in until it<br />
starts flashing (you must remember to push this in again after you read<br />
the impedances and before you start the feedback display otherwise<br />
garbage is fed to the computer instead of the EEG.- (note: a program<br />
glitch is being fixed, impedance may not always work – it can fail<br />
most often when channel ‘A’ has an EMG wire into it.)<br />
• If you are using the procomp+ encoder then you must remove the<br />
EEG wire to channel A and reinsert it.<br />
• If you are using the Procomp2 then you must use channel B for the<br />
EEG. Channel B requires that, unlike channel A, you must use a<br />
triangular EEG-Z preamp.<br />
• When the impedance figures come up, ideally you want them all to be<br />
green. Better still is to have them all < 5 Kohms and within 1 Kohm of<br />
each other. This strict rule is necessary for research but is unrealistic<br />
for regular NFB sessions due to the limited time frames for these<br />
sessions and the forgiving nature of modern amplifiers (high input<br />
impedance). However, if the impedances are high you should note this<br />
when you save data because it will affect magnitudes.<br />
• If possible, re-clean and prep sites that are red. This rule must always<br />
be counterbalanced by common sense. You mustn’t overdo it to the<br />
point of causing injury to the skin. It is also not sensible to spend too<br />
much time preparing electrode sites – for regular feedback they don’t<br />
have to be perfect. Again, just note on any data saved what they were<br />
so that you are not running trend reports with poor data in them. (We<br />
have noted that with training eye-blink effects often decrease (possibly<br />
due to anxiety decreasing). Therefore the best trend report will be one<br />
that only includes artifacted records.<br />
Later, when you review the data from a saved session you can alter customize what<br />
you are doing. The figure shown below is the box you will see when you go to review<br />
a saved session. Note the “edit virtual channel settings” item in the top right corner of<br />
the Channel Set Options.<br />
Copyright ADD Centres Ltd. Prepublication – 1 st draft. Please do not copy. Dr. Thompson 905-803-8066 Canada 55
Channel set is PI MT 1EEG-Physio-HRV FB.chs<br />
ii. To change frequency band:<br />
You can change band-widths. Do this when you have started a session with a client. Do<br />
NOT do this when reviewing data because it will NOT be saved to that client’s name.<br />
You can choose to alter a channel if it better fits your client’s needs. For example if, in<br />
the assessment, your client had very high average 13 Hz activity but a real dip in 14 and<br />
15 you might choose to alter the SMR bandwidth from 13-15 to 14-15.<br />
To do this kind of change:<br />
• Click ‘Edit’, edit virtual channel settings (at the top of your display screen).<br />
• Take the frequency band closest to one you want changed.<br />
• Highlight it and in the right hand column change upper and lower levels of<br />
the band width e.g., 13-15 to 14-15 Hz.<br />
• NOTE: You ONLY have to change the FIRST ONE; i.e., you only<br />
change the first set of virtual channels, the IIR raw EEG channels, e.g.,<br />
V5 to V25 where it just says “band” and “Hz”. You do not need to<br />
change all the later sets of band widths with specific purposes like “pkpk”<br />
and “damper” etc. The Program automatically changes the others. In<br />
reality all of them are based on the first one which is an IIR raw EEG.<br />
This is why they do not need to be changed. When you make a change<br />
in the numbers this change does NOT change the name for that band.<br />
This can be confusing. Not so much for a real name like SMR because<br />
in the forgoing example you could just write in your notes that you<br />
Copyright ADD Centres Ltd. Prepublication – 1 st draft. Please do not copy. Dr. Thompson 905-803-8066 Canada 56
changed it each session to 14-15 Hz. It is more confusing if the “name”<br />
is a number like 3-10 Hz and you changed it to 5-9 Hz but the name for<br />
the channel in the statistics still gets printed as 3-10 Hz. Thus you must<br />
be careful to cross the incorrect band width out and write in the correct<br />
band-width on your statistics print out each day. This is one of the<br />
reasons that the MT channel sets have so many bandwidths. We tried to<br />
pick as many of the common possibilities as we could so this confusion<br />
would be lessened.<br />
iii. To change the speed (damper) of movement of the feedback instrument.<br />
You need to use what is called a “damper” in the infiniti program to do this:<br />
• Go to ‘Edit’, edit virtual channel settings (at the top of your display screen).<br />
Find the band width you wish to alter (e.g., SMR pk-pk + damper) highlight it<br />
and a time period will appear in a small box on the right. Change this time<br />
period. A higher number will take more time before displaying a change<br />
(e.g., the speed of the bargraph moving up and down). At the ADD Centre we<br />
have changed all the defaults from 0.2 to 5 in order to have the bargraphs<br />
initially move at speed that is not distracting to a new client. This could<br />
usefully be speeded up in later sessions to give faster, more direct feedback.<br />
It is always a trade off between what the client can handle and your desire to<br />
give the most accurate instantaneous feedback. Over the years we have<br />
found that even our young clients get interested and take up the challenge of<br />
having the feedback speed increased.<br />
Copyright ADD Centres Ltd. Prepublication – 1 st draft. Please do not copy. Dr. Thompson 905-803-8066 Canada 57
This figure was also shown earlier.<br />
iv. To change Threshold for “%-above-threshold”:<br />
Click the appropriate bandwidth for this function, e.g., “C theta %<br />
time>C” and input 2 constant value pops up. You can now change<br />
this number to your new threshold setting. For example, the default<br />
for theta might have been 10 when the program was loaded into your<br />
computer. This is too low for most people and far too low for a<br />
child. You may find that the child you are working with had a mean<br />
microvolt level for theta (4-8 Hz) of 24 when you did the initial<br />
assessment. You would reset this value then to 24 and save it (but<br />
not to the original channel set unless you want it to be set to 24 for<br />
all clients from this time on.) If you just use the first option, “Save<br />
changes”, then it saves it ONLY for the client you are working with<br />
at this moment. That is, it will save the new values in the channel set<br />
settings for this session, for this client, and only for this set of 5<br />
screens.<br />
Your new entry becomes the microvolt level for the threshold for each of the bandwidths<br />
that you want to do. Don’t be confused. This “C” in “theta % time>C” doesn’t mean<br />
‘channel’ it means a “Constant”. Indeed you are going to make this constant a microvolt<br />
level threshold for the client you are working with. When you do this it doesn’t matter<br />
which of the 5 screens you have chosen for feedback, this is always the threshold for the<br />
%-time-greater-than-threshold calculations. This threshold is also completely<br />
independent of your moving the actual threshold on bargraphs on the screen. This makes<br />
Copyright ADD Centres Ltd. Prepublication – 1 st draft. Please do not copy. Dr. Thompson 905-803-8066 Canada 58
it possible to carry out “shaping” moving the threshold to make it harder and harder as we<br />
do with the skeleton screen and still have a standard %>threshold number on the screen.<br />
In Summary: Take the values of the ‘means’ recorded above in statistics and click ‘Edit’<br />
and open Edit Channel Settings. Go half way down the list and change the constant for<br />
each of the statistics that you are recording and which are on the bargraphs on your<br />
feedback screens.<br />
In the above example if he statistics had shown that this child’s ‘mean’ value for 3-10Hz<br />
was 24 we would change this constant from the default value of 10 to a new value of 24 .<br />
We would then click ‘save changes’. But we would NOT click: Save “Changes to<br />
Original Channel Set” because that would change the default for every client.<br />
Now SAVE SOME DATA. If you don’t run the session save some data your changes to<br />
‘Edit’ and to ‘Options’ will NOT be saved o your client’s name.<br />
Next time a session is recorded for this client you will note that these changes<br />
have been happily attached to the client’s name so that it will be in place<br />
for this client no matter what display screens are used. Thought Tech<br />
responded to our request to do this and it is now done! (Of course it will<br />
only appear on the displays that have theta %>threshold counters on the<br />
screen.)<br />
• If you want this %-over-threshold (% time > C) in your stats you must<br />
also check it off in ‘Options’ set open display stats. Alternatively you<br />
or your client can just write down the points and the %-over-threshold<br />
scores after each three to 5 minute segment of the session. In either<br />
case, the client keeps trying to better their scores.<br />
Copyright ADD Centres Ltd. Prepublication – 1 st draft. Please do not copy. Dr. Thompson 905-803-8066 Canada 59
• If a session was recorded with the channel settings changed, the<br />
settings are remembered when the session is reviewed. (You can<br />
change the settings again when reviewing BUT (unlike when you do<br />
this when recording a session) if done when reviewing using the data<br />
base then it will only be a temporary change for that recorded client<br />
session.)<br />
Alternatively you can save changes permanently in the channel set,<br />
• The only way to make a permanent change of the channel set for all clients<br />
is to tell it in the box below save changes, to change original channel set.<br />
• Then it is changed for all clients and sessions until you re-enter this<br />
change channel set option and make and save new values. (But it only<br />
changes the channel set if you are running the program with the client<br />
attached and save the session. As noted above, it does not save changes that<br />
you make when you are reviewing data!)<br />
We suggest that you DO NOT CLICK on the “Save all changes to original<br />
channel set” UNLESS you clearly want to change the definition of a channel set,<br />
e.g., change ‘thalpha from 6-10 to 5-9 Hz permanently in that channel set.<br />
v. Description of the Session<br />
After you run a feedback session and if you save recorded data, you are given the<br />
opportunity to save a description of this saved assessment or session for you<br />
records<br />
• You can also enter a description for your assessment records after you<br />
say you don’t want to run another session and hit STOP, or “cancel”. The<br />
program will then remind you to turn off your encoder and it will put you<br />
back to the “Infiniti Software System” main screen.<br />
• Click Database<br />
• “Highlight” the client name and click the last session.<br />
• Click Session Notes and write into the description line. You may also enter<br />
here the essentials for identifying that session for a pre-post training<br />
comparison.<br />
• When doing training you would be wise to always do this following<br />
each session that is saved in order to do meaningful trend reports using<br />
other sessions that are at the same active site with the same reference<br />
site in the same condition (eo, ec, reading, math). The time-of-day and<br />
date are automatically put in by the computer.<br />
• Example of an entry after a session: eo dot, Cz to L, not art, (This<br />
means eyes open looking at a dot, active electrode at Cz is<br />
referenced to the left ear, and it has not been artifacted).<br />
vi. Notes on Statistics<br />
Statistics automatically pop up when you are running sessions and you hit stop. You can<br />
read them and, if you so choose, you can print them to word. However, you cannot leave<br />
word open and go back and run the feedback program. Therefore you must either print<br />
the statistics from word and close it, or save it and then close.<br />
Copyright ADD Centres Ltd. Prepublication – 1 st draft. Please do not copy. Dr. Thompson 905-803-8066 Canada 60
To reduce the number of files you end up saving on your computer, you can highlight the<br />
next statistics you “print” to word, highlight only the numbers and then go to edit and<br />
click ‘copy’. Now close this new file and open the first statistics file that you made for<br />
that client and ‘paste’ this second (or third and so on) set of stats in a column to the right<br />
of the last session statistics (see appendix for full description of how to do this) and then<br />
close word. This is somewhat time consuming and this is one of the reasons our staff has<br />
chosen to all their saving of statistics on the client’s ‘excel’ sheet which can be running<br />
the whole time in the background while you are doing your session with the client.<br />
• We really hope that the next edition of this program will show stats for each<br />
segment of the session in a sequence of columns not only for the “script”<br />
sessions but also for the open display screens. Then you would only have to<br />
“print statistics” to a word document once.<br />
Note: It can be quite effective to do ‘trends’ within each session and over a series of<br />
sessions with the client. Handwriting in the numbers and drawing the graph together with<br />
your client is a very positive interaction that can prove highly supportive and motivating<br />
for the client. To this end we designed Trend Sheets for our staff at the <strong>Bio</strong>feedback<br />
Institute and have included them in the Appendix of this document.<br />
vii. Using Means for Starting Thresholds<br />
As explained in Part 2, when STATS pop up, look at the means. These will probably be a<br />
good starting point for your thresholds on the instruments on the different screens<br />
for that client.<br />
• As previously noted 2 pages back, these will also be a good starting point for the<br />
“on screen” %-over-threshold calculations. (Note also our comments on changing<br />
% > C in the channel set. These ideas are written out in paragraphs both above and<br />
immediately below this section.)<br />
Set Thresholds<br />
Important: We have Linked (using Screen Editor) the “game” (balance beam, dolphin,<br />
maze, car, bags of gold, bowling etc.) to the bargraph thresholds that you can move and<br />
change on the screen (unlike the C (constants) that we just discussed above, which re<br />
independent of the threshold line on the bargraph). For most screens we have made the<br />
game dependent on all criteria being met (e.g., theta below threshold, SMR or low beta<br />
above threshold, and no EMG interference i.e., below threshold). However, there are<br />
exceptions such as the dancing car screen where the sound etc. is only dependent on the<br />
‘ratio’ bargraph, and the Skeleton screen where the movement of the skeleton and the<br />
sound is solely dependent on one bargraph (usually theta). You will want to change the<br />
thresholds of the bargraphs on the screen before you start the feedback. Do this as<br />
follows:<br />
• Change the threshold of each bar-graph (or other EEG instrument) to the<br />
same “mean” that you just used as a constant for the thresholds for the “%-<br />
over-threshold” calculations for that bandwidth. Alternatively, since the client<br />
must achieve all items at the same time, make each bargraph threshold a little<br />
easier than the ‘means’ you saw in the statistics. Theta threshold would be<br />
slightly higher and SMR or beta a little lower. This way the display screen has<br />
“face value” and yet will be easy enough to get rewards about 60% of the<br />
time. Children require a higher % of time rewards or they give up. This will<br />
Copyright ADD Centres Ltd. Prepublication – 1 st draft. Please do not copy. Dr. Thompson 905-803-8066 Canada 61
change as training progresses. (Note: the % of time over threshold really does<br />
approximate what the client sees happening on the screen.)<br />
• When feedback is going you can alter the bargraph threshold in order to<br />
encourage a client or in order to make achieving the game progressively more<br />
difficult (‘shaping’).<br />
As feedback proceeds you want %-above-threshold ‘Constants’ to start at about 50 % in<br />
the first session. Thus we suggest that you start with 50 % for any bandwidth that you are<br />
inhibiting such as Theta, Thalpha, or High Beta and the client tries to gradually improve<br />
this number as training proceeds. Clients try to lower an inhibit frequency’s time over<br />
threshold and increase an enhance frequency’s time over threshold.<br />
Important note: Children get easily discouraged and then they just stop trying. Your job<br />
is not to allow this to happen. You must instantly make the thresholds easier then, as the<br />
child becomes keen and interested, you gradually move back to more challenging<br />
settings.<br />
viii. While Running a Display Screen: Changing Scale or<br />
Thresholds<br />
You can right click over any instrument and do some quick alterations. WE only have<br />
auto-scale checked off briefly because any big deviation will rescale the instrument and it<br />
takes time to correct that. You should just run some saved data and experiment with this.<br />
In the above figure we Right clicked over the 13-15Hz Instrument<br />
On the display screen you can also left click over any instrument – a purple box appears<br />
around it – then you can:<br />
Copyright ADD Centres Ltd. Prepublication – 1 st draft. Please do not copy. Dr. Thompson 905-803-8066 Canada 62
• Change the ‘y’ scale at the left side to make it more or less sensitive. Use the min<br />
and max boxes in the upper left corner<br />
• If there are 2 ‘y’ scales you can hit the figure at the far upper left<br />
corner of the screen. This is a toggle switch to change to the right hand<br />
side ‘y’ scale.<br />
• Change the threshold (but you can do this also by left clicking the mouse over the<br />
red threshold line and dragging it).<br />
• Important – changing a threshold in this way does NOT change it for<br />
the %-over-threshold instrument if you have one on the screen.<br />
• The %-over-threshold instrument can only be changed in the virtual<br />
channel set opposite any band width that says: Thalpha (or any other<br />
band width appropriate to instrument’s threshold you wish to alter) %<br />
time > C (where ‘C’ is a constant that appears on the right side when<br />
you highlight that bandwidth). Then click save changes.<br />
• Exceptions:<br />
• When you click on “save changes” the program will save<br />
them for this client with this channel set.<br />
• You get the option of clicking on “ Save all changes to<br />
Original Channel Set”. We remind you that this would<br />
make a permanent change in your Infiniti program channel<br />
set for all future clients and sessions. We suggest that you<br />
do NOT click on this item.<br />
ix. Hiding <strong>Instruments</strong>:<br />
Click ‘View’ and choose which ever instrument you wish to hide.<br />
Screens A1-1, A1-10, A1-11 and A1-2 all have the animation dependent on meeting all<br />
variables. These screens all have points and %>threshold for each of the variables. For<br />
some children (particularly younger children) you may feel that these extra measures<br />
Copyright ADD Centres Ltd. Prepublication – 1 st draft. Please do not copy. Dr. Thompson 905-803-8066 Canada 63
clutter the screen, distract the child and do not add any useful information. It is easier to<br />
delete or hide unwanted instruments in this program than to make new instruments and<br />
we have made our screens ‘over-inclusive’ with this thought in mind. With our ‘overinclusive’<br />
screens you can just hide these instruments ( click View in the top menu bar<br />
and then Hide <strong>Instruments</strong>). Alternatively, go to ‘edit’ and delete the unwanted<br />
instruments and rename the screen. Below is an example of how to ‘hide’ unwanted<br />
labels, numerics and counters from the maze screen.<br />
Click view and Hide <strong>Instruments</strong>. Now just check off the instruments you wish to hide as<br />
shown below.<br />
Copyright ADD Centres Ltd. Prepublication – 1 st draft. Please do not copy. Dr. Thompson 905-803-8066 Canada 64
This is quite an effective method of hiding instruments. It is particularly useful because<br />
the ‘instruments’ that are hidden are still available for use if you ‘uncheck’ them.<br />
Viewing EEG Line:<br />
Click ‘Options’ then graph mode then choose what you want.<br />
x. Dual Monitors<br />
To view a two monitor display or to move instruments on to a second monitor for the<br />
client to view you will first have to adjust your Windows program. To do this click Start<br />
in the bottom left hand corner of your screen. Click Control Panel and then Display.<br />
When you are in the Display box go to Settings. Now click over the second monitor (# 2)<br />
and you will then be asked (lower left) if you wish to Extend my Windows desktop onto<br />
this monitor. Check off this box, click Apply and then OK. When you go back to any<br />
editing screen (described below in part III) you can put the mouse on the right side of the<br />
screen and drag it across your second monitor. Now you can choose any instrument and<br />
move it with your mouse to the second monitor. If you moved an animation, for example,<br />
you could then extend the sides of the animation to fill the whole screen if that is what<br />
would be best for your client’s feedback. You MUST remember to rename the screen<br />
using Save-as. This way you will still have the original in case you made a mistake.<br />
Below the illustration shows how you check the box that tells Windows to allow you to<br />
extend the screen on to a second monitor.<br />
Copyright ADD Centres Ltd. Prepublication – 1 st draft. Please do not copy. Dr. Thompson 905-803-8066 Canada 65
Now you click ‘apply’ and then OK. Now, in the Infinity program’s screen editor you can<br />
click the right side of the screen and when you get a double arrow you can hold the<br />
mouse button down and drag the edge of the screen across the entire second monitor. You<br />
will only see the ‘background’ colour on the second screen at this juncture. At this point<br />
you left click any item on the left (original) monitor and hold the mouse button down and<br />
drag that item across to the client’s screen. Examples may be found under screen<br />
descriptions later in this guide.<br />
III. SCREEN EDITOR using<br />
‘Edit Selected Screen in Screen Editor’<br />
i. Introduction<br />
This section does not cover How To Make a Display Screen. That is covered in PART 4<br />
below. Please refer to that section for more detail. Here we only wish to give a few<br />
pointers on using the menu: Screens, - ‘Edit Selected Screen in Screen Editor’.<br />
This program very conveniently allows you to make changes to the screen you are<br />
running. For the most part, we have tried to give a sufficient battery of display screens<br />
(see Part 1 above) so that you can pick a screen that is reasonably close to what you want<br />
for a particular client and just make some minor alterations. By minor alterations we<br />
mean such things as changing the animation display or changing the sound feedback.<br />
However, for the more adventurous, we have provided an initial Universal Dual Monitor<br />
Display Screens that can be used to make a vast array of client feedback screens that will<br />
appear on the second monitor without having to go through all the complexities of<br />
making screens with multiple linkages from scratch.<br />
ii. Animations<br />
To change an animation click Screen followed by Edit Selected Screen in Screen Editor<br />
and then right click over the animation display. Click Instrument Settings and choose<br />
from one of the many animation displays. If you highlight one then you can just use your<br />
arrow key to scroll up and down the list and see what the animation will look like in the<br />
box to the right of the list. You can also see how they will unfold by moving the ruler<br />
button below the animation in the upper left corner of this box. When you have chosen<br />
an animation you will then click on the Threshold Settings box and set the frame rate and<br />
direction commands. In frame rate (you will probably have to reset this after running the<br />
screen) ‘1’ is slow (e.g., a puzzle) and ‘15’ is quite fast (e.g., bowling). You would use<br />
cycle when you want the animation to start over again when it reaches the end. You<br />
would use this, for example, with the bowling game but you would not use it with a<br />
balance beam. You would choose one way so the bowling ball doesn’t go both forwards<br />
and backwards. However you would choose both ways for the ball on a balance beam.<br />
Don’t change the other variables. These other variables are explained under Part 4, How<br />
to Make a Display Screen.<br />
Copyright ADD Centres Ltd. Prepublication – 1 st draft. Please do not copy. Dr. Thompson 905-803-8066 Canada 66
Pot-O-Gold settings at ‘cycle’ and ‘one way’<br />
iii. Sound Feedback<br />
When you click ‘sound’ you can choose music (Midi songs like “When the Saints…”,<br />
MP3 files like marching with drums…, Midi tones or brief signals such as a ding which<br />
are contained under Play Wave files. The ‘wave files’ allow you to give a constant sound<br />
or a proportional sound. Experiment with these in order to understand how they play out.<br />
• Check off Loop so the sound plays every time you meet criteria<br />
• Set the Interval Time. SMALL GLITCH: This is slightly complicated. We have<br />
found that, for example, when we set a counter to give points every 2 seconds<br />
that the client meets all criteria, that the sound needs to be set at 1 second in<br />
order to ‘ding’ every time this point counter gives another point. But when we<br />
do this it works beautifully (see the PI MT 1EEG-Resp Universal display<br />
screen). This may be different on your computer.<br />
Copyright ADD Centres Ltd. Prepublication – 1 st draft. Please do not copy. Dr. Thompson 905-803-8066 Canada 67
In the above screen we chose Play Midi Songs and under ‘settings’ we chose<br />
yak… and ‘loop’<br />
iv. Other Variables<br />
It is fairly simple to change other variables such as background colour and the text or<br />
label boxes to descriptions that are more to your liking. Just right click any box or<br />
instrument on the screen and click the variable you wish to alter. You can alter the<br />
background colour, the signal colour, change the channel setting, enter a sound<br />
feedback or alter the instrument settings which include scale, threshold line starting<br />
point, type of threshold or colour for the feedback when it is above threshold. (Below<br />
threshold colour can also be changed but it is called the default signal colour).<br />
(Note: if you cannot see a threshold line it could be that the default black signal colour is<br />
being played against a black background!!) Usually the threshold type is set to manual.<br />
However, the “lagged” threshold is one we sometimes use on a bar (5 th icon from the left<br />
at the top of the screen) instrument for temperature, EDR, or EMG. The last place where<br />
that variable was is shown and it helps to indicate to the client the direction in which they<br />
are changing that parameter. Again, experiment with these variables and see what fits for<br />
the work that you do.<br />
You can even right click the screen background and change the colour or change it to a<br />
picture.<br />
Copyright ADD Centres Ltd. Prepublication – 1 st draft. Please do not copy. Dr. Thompson 905-803-8066 Canada 68
IV. CHANNEL SETS<br />
Very brief Notes on Editing Channel Sets<br />
Note 1: In Infiniti only IIR filters are used. These give fast and precise feedback. The<br />
“order” of the IIR filter can be changed in the channel set if you have this advanced<br />
means of making new channel sets. Higher order filters are “sharper” but slower because<br />
order refers to the number of times the sample goes through the filter. A higher order<br />
filter may be used for reviewing data for statistical computation. A lower order filter is<br />
faster so it would be more appropriate for feedback.<br />
Note 2: In the Infiniti program the computer must process information by going through<br />
every virtual channel (from V1 to V254 if all the virtual channels are used) each time it<br />
does a calculation. Therefore a channel set that uses a great many virtual channels<br />
(maximum 254) will take longer to process information than a channel set that only uses<br />
a few virtual channels. However, on today’s fast PC’s the delay is insignificant. We<br />
chose to have a great many virtual channels in the MT “Thompson” channel set in order<br />
that most of your display screens would work on the same channel set. We felt this would<br />
be less confusing for you when starting out with the Infiniti program.<br />
Note 3: If you are making a channel set we suggest that you leave spaces between the<br />
virtual channels to add additional channels that you may think of later. Also, never click<br />
“optimize” because this would eliminate all empty virtual channel sites that you had left<br />
to fill in later with channel widths that you had forgotten when you first made that<br />
channel set.<br />
Note 4. The channel set must proceed in a definite order. Bandwidths must first be<br />
defined by frequency and IIR filter. Then all those bandwidths must be put down in series<br />
again but this time stating whether they should be pk-pk or RMS (root mean square).<br />
(Note: The old biograph program used peak to peak.) Then they must be listed again with<br />
a damper (so that the trainer can slow down or speed up an instrument). Then they are<br />
listed again and again and again for each statistic that you want to have available such as<br />
% of total power, %>C, mean, max, min, standard deviation, variability and so on. We<br />
suggest that if you have purchased the channel editor and are going to be doing this that<br />
you print out a comprehensive EEG channel set, such as the MT “Thompson” set, and<br />
use this as a model. An example is shown below:<br />
Copyright ADD Centres Ltd. Prepublication – 1 st draft. Please do not copy. Dr. Thompson 905-803-8066 Canada 69
Click on the box at the lower left corner to get:<br />
You can now scroll down the virtual channels and as you go you will see how the<br />
bandwidths are changed to pk-pk, then pk-pk+damper, and then you find ___%>C<br />
which you have already learned you can change as you enter the Infiniti program in<br />
order to customize the C (constant) to an appropriate threshold level for your client.<br />
Copyright ADD Centres Ltd. Prepublication – 1 st draft. Please do not copy. Dr. Thompson 905-803-8066 Canada 70
Further on you will see various statistical options that you can use when you are<br />
assessing and training your client. Perhaps the most useful one is the mean as is seen<br />
below:<br />
Copyright ADD Centres Ltd. Prepublication – 1 st draft. Please do not copy. Dr. Thompson 905-803-8066 Canada 71
Note 5. You can change the channel set but be careful. Don’t change the physical<br />
channel or the data on any clients you have run will not come up. It is best to give a<br />
changed channel set a new name. In this manner your old screens will not be lost or<br />
damaged. You can now make new screens that you base on the new channel set.<br />
To make a New Channel<br />
For the sake of giving you an example, let us say that you want to have a complex ratio<br />
for statistics such as (4-8/13-21) 2 where 4-8 Hz and 13-21 Hz refer to the means of these<br />
two band widths that are based on a pk-pk computation of microvolt magnitude<br />
(amplitude over time). This ratio squared (if there is not much variability in the artifacted<br />
data) will be fairly close to a power ratio in picowatts that can be found in the literature<br />
on ADD. (As explained previously, it will not be exactly the same due to other factors<br />
such as ‘windowing’.)<br />
• Print out the channel set by clicking the clip board at the bottom of the left<br />
column. Then use this to help you pick a virtual channel to use. You could use a<br />
free channel near the end of the channels – say in the 200s. If all 254 channels<br />
are filled then you must eliminate a couple of channels. The virtual channels that<br />
you use for this computation must come AFTER the virtual channels that<br />
calculate means that you will be using in the division.<br />
• Now go to the last calculator on the left column called virtual channels but do<br />
NOT depress it yet. Hold the right arrow key down and you will rapidly scroll<br />
through the virtual channels until you reach the channel you are going to change.<br />
Click the arrow opposite computation and find “division”. You will have to<br />
cancel a couple of menus that pop up before you see two source openings above<br />
the computation division. Now search for 4-8 Hz mean. Enter this virtual channel<br />
in the first source. Do the same search with the second source and enter the<br />
virtual channel for the 13-21 Hz mean.<br />
• Now you must square the result of the Virtual Channel that you just made.<br />
Go to the next empty channel or channel you can do without (but it must be after (higher<br />
number) than the one you just made. Again click computation but this time choose<br />
multiplication. Once again there will be two sources and you just put into each of them<br />
the virtual channel ratio that you just made (4-8/13-21) so you multiply it by itself. Don’t<br />
forget to give your new virtual channels a clear name under description such as: ‘(4-8/13-<br />
21) squared ratio’.<br />
Copyright ADD Centres Ltd. Prepublication – 1 st draft. Please do not copy. Dr. Thompson 905-803-8066 Canada 72
V. BACKING-UP Your Display Screens, Scripts and Data<br />
Computers do crash. Backing up your program data with all the channel sets, screens and<br />
scripts, that did not come on the original program disk that you purchased, is simple.<br />
Backing up the data will probably work with the simple back-up procedure described<br />
below.<br />
Use windows explorer or your CD back-up program. Copy the following on to your CD:<br />
• Channels sets<br />
• Screens<br />
• Scripts<br />
• Clients folder<br />
• CSDB.TTL In addition to the “clients folder” you must have CSDB.TTL<br />
which contains a list of all your clients and settings and allows the program<br />
to associate these with channel sets used for each of your screens.<br />
However the safest way to backup client data is to use EXPORT which copies all<br />
client sessions. Say where you want to copy it to and when you lose data just use<br />
‘Import’ to import that client back to the data base on the Infiniti main application<br />
(bottom left see import and export).<br />
VI. Other Useful Channel Sets and Screens<br />
1. 3 Musical <strong>Instruments</strong> - goal to keep three instruments playing<br />
• Channel Set P1 1 EEG IIR Feedbacks<br />
• Screen Name P1 EEG 1 Ch Beta1 – Midi Splitter.scr<br />
• Screen Name P1 EEG 1 Ch SMR – Midi Splitter.scr<br />
• Screen Name P1 EEG 1 Ch Gamma – Midi Splitter.scr<br />
• Screen Name P1 EEG 1 Ch User – Midi Splitter.scr<br />
2. Alpha / Theta Alpha high pitch, theta low pitch above threshold with horizontal scale<br />
instrument which emits high bell tone when the alpha/theta ratio threshold is<br />
crossed. A line graph at the top shows alpha and theta amplitudes.<br />
The goal is to generate all three tones by keeping alpha and theta above threshold and<br />
both EMG and Delta inhibits below threshold. The dynamic interplay between<br />
alpha and theta is seen in the line graphs at the top of the screen.<br />
• Channel Set P2 EEG – A SC-D.chs<br />
• Screen Name P2 EEG –A SC-D.chs<br />
3. Mind Mirror with % power – 2 Channel<br />
• Channel Set P1 2 EEG IIR Feedback.chs<br />
• Screen Name P1 EEG 2Ch Review – Line Graphs 2D FFT.scr<br />
4. 3d Spectrum with the raw EEG<br />
• Channel Set P1 EEG IIR Feedbacks<br />
• Screen Name P1 EEG 1 Ch Review – Line Graph 3D FFT.scr<br />
5. 2 Channel Training with Coins<br />
• Channel Set P1 1 EEG IIR Feedbacks<br />
• Screen Name P1 EEG 2Ch User – FB Bilateral Conditions 01.scr (or 02)<br />
Copyright ADD Centres Ltd. Prepublication – 1 st draft. Please do not copy. Dr. Thompson 905-803-8066 Canada 73
PART 4: How to Make a Display Screen<br />
Making a Feedback Screen - the basic steps<br />
i. Introduction<br />
We do not recommend making screens from scratch. Our goal has been to make a<br />
channel set and a set of screens that you could alter sufficiently so that you would not<br />
need to make a screen from scratch. We have also, for the more adventurous clinicians,<br />
included a dual monitor ‘Universal display’. This ‘universal’ screen can be used to make<br />
almost any other screen. However, for those of you who wish to try making a feedback<br />
screen we have outlined the basic steps and the ‘glitches’ that may appear along the way.<br />
ii. Order for Putting <strong>Instruments</strong> on to the Screen<br />
First there is a definite order to placing instruments on to the screen. If you do not follow<br />
this order you may find yourself in trouble. We suggest that you put instruments on to the<br />
screen in the following sequence: (The starred items cannot be done in another order!)<br />
1 st *The raw EEG (note that it must be ‘bipolar’)<br />
2 nd *FFT spectrums<br />
3 rd *Line graphs for:<br />
• EEG band widths<br />
• BFB variables such as respiration, heart rate, EDR, temperature and EMG.<br />
4 th * Inhibit bargraphs or expanding squares & ovals. These may include inhibits for<br />
EMG noise (52-58 Hz), slow waves (theta), high beta and so on.<br />
5 th * Enhance bargraphs or expanding squares & ovals. These may be for such variables<br />
as SMR, problem solving beta, sheer rhythm and so on.<br />
6 th Links for the Points counters followed by the counters [enhance instruments and<br />
selected inhibits (theta and high beta)]<br />
7 th %-over-threshold for both the enhance and the inhibit instruments.<br />
8 th * 2 Links and a Counter for the Animation<br />
9 th * The animation and sound feedback<br />
10 th * The link for the points for meeting all criteria<br />
11 th * The Counter for giving points for meeting all criteria.<br />
12 th Boxes for microvolt values for enhance and inhibit bands and ratios can be added at<br />
any time.<br />
13 th Labels for all the instruments can also be added at any time.<br />
iii. Inhibits<br />
1. It is crucial that you enter inhibit bargraphs before your enter animations. The<br />
usual inhibit band-widths with their attachments in the channel set are:<br />
• EMG - “peak-peak + damper” (52-58 Hz EMG ‘noise’)<br />
• Theta - “peak-peak + damper” ( OR other slow wave frequencies such as 3-10<br />
Hz or Delta-Theta (3-7 Hz) and so on)<br />
• High Beta - “peak-peak + damper” (This may be ‘intensity at 19-22 Hz,<br />
busybrain at 23-35 Hz, and so on)<br />
Copyright ADD Centres Ltd. Prepublication – 1 st draft. Please do not copy. Dr. Thompson 905-803-8066 Canada 74
To make an Inhibit Bargraph<br />
Very Important Note – In what follows you are going to be giving all your instruments<br />
(including links and counters) an Output Name. As previously mentioned, you may, later<br />
on in another session, change an instrument’s settings, for example you might change the<br />
channel setting for the 4-8Hz Theta (which could be the ‘output name’ of the instrument)<br />
bargraph. You could under Set Channels, for example, change the channel from C: 4-8<br />
Hz pk-pk + damper to C: 5-9 Hz pk-pk + damper. However you do NOT under any<br />
circumstances change the Instrument Output Name. The ‘Output Name’ is the name other<br />
instruments, that are linked together, look for. This name could just as well have been<br />
“Tom, Dick, or Harry”. In fact it probably would be less confusing in the long run to give<br />
completely unrelated names to instruments. The reason I say that is that next time you go<br />
into the screen editor you may have changed the channel from 4-8 Hz to 5-9 Hz but the<br />
name on the bargraph in screen editor in the upper left hand corner of the instrument<br />
might be still 4-8Hz and NOT 5-9Hz. The only way to lesson your confusion is to<br />
always put the new name in the ‘Label’ box ABOVE that instrument whenever you<br />
change the channel.<br />
IMPORTANT NOTE: To help avoid this confusion, in the newest MT channel set, with<br />
screens we have decide to use out put names such as: Enhance1, Enhance2 …. And<br />
Inhibit1, Inhibit2…. So that you do not see a specific name such as SMR on the bargraph<br />
after you changed that SMR to be Problem-solving beta. This used to be very confusing<br />
so we hope this way of naming will be less confusing and also remind you to always<br />
change an enhance to another enhance and an inhibit to another inhibit but LEAVE THE<br />
NAME ALONE. Enhance2 may be changed to beta which on other screens is called<br />
Enhance3 but DON’T change it – it must remain as Enhance2 on this screen in order that<br />
all the instruments attached to it (sound, animation, points) know where to refer to.<br />
Example is 4-8 Hz Theta activity.<br />
1. On the menu bar at the top of the screen click bargraph or, alternatively, growing<br />
shape. When you the left click on the screen a menu will come up called Channel<br />
select. You must choose C: 4-8 Hz pk-pk + damper. When this bargraph or growbox<br />
appears on the screen you right click it and move from top to bottom through the menu<br />
options. The Background Color default is black and it can be changed. The Default<br />
Signal Color refers to the color below threshold. You would like this to be green.<br />
The next item Instrument Settings is a little more complicated. The Scale Settings will<br />
cover the most common range for your clients which for children’s theta would<br />
usually be a scale setting of 0 to 40. You want to Show Scale. The Threshold Type<br />
will be Manual so that it can be changed while running the program. The beginning<br />
Threshold Value, if the majority of your clients are young children, might be 18. The<br />
Feedback color refers to the colour above threshold so you would want it to be red for<br />
theta above threshold. The Instrument Output Name usually describes the instrument<br />
you are making so you might call this instrument: 4-8 Hz Theta (now inhibit #..) (but<br />
as noted above it could just as easily be called ‘Tom, Dick or Harry’). It is important<br />
that the next item, Output ON be set at Above Threshold. You want Change Colour<br />
with to be Threshold. If you decided to use a growing shape then it is at this point<br />
that you would choose rectangle or ellipse. On our ‘Universal display’ we made all the<br />
inhibits rectangles and the enhances ovals.<br />
Copyright ADD Centres Ltd. Prepublication – 1 st draft. Please do not copy. Dr. Thompson 905-803-8066 Canada 75
Sound: You may decide to leave ‘sound’ blank because you may prefer to attach sound<br />
feedback to the animation. We have therefore described this under animation below.<br />
If you did attach it to this instrument you would likely prefer to have it rewarding theta<br />
being below threshold and therefore would click the arrow in that box on the right side<br />
of the set sound feedback box.<br />
iv. Enhance <strong>Instruments</strong><br />
Enter reward bargraphs:<br />
• hi alpha - “peak-peak + damper”<br />
• SMR - “peak-peak + damper”<br />
• Problem solving beta - “peak-peak + damper”<br />
• Sheer rhythm – “peak-peak + damper”<br />
To make an Enhance Bargraph<br />
Follow the same steps as were outlined above under To make an Inhibit Bargraph.<br />
However, note that the colour below threshold should now be red and above threshold it<br />
should be green. The scale (y-axis), compared to your ‘theta’ bargraph, would be much<br />
smaller and the threshold would be set at a lower level. In addition if you were using a<br />
sound feedback it would most likely be for above threshold. An example of these<br />
instrument settings is shown below.<br />
Note that is connected to channel C: SMR<br />
pk-pk + damper.<br />
The scale for SMR has been set to 10.<br />
It is a manual threshold but the number<br />
in the box needs to be reset!!<br />
It would probably be set to 3, 4 or 5<br />
microvolts.<br />
The feedback colour is green for above<br />
threshold.<br />
v. Counters for Single Bandwidth <strong>Instruments</strong><br />
These are fairly simple to make and attach to the appropriate instrument. However there<br />
are 2 steps.<br />
1 st Make a Link by clicking the link icon on the menu bar at the top of the screen. Then<br />
click the screen and a box will appear allowing you to click Instrument Settings. In<br />
Copyright ADD Centres Ltd. Prepublication – 1 st draft. Please do not copy. Dr. Thompson 905-803-8066 Canada 76
the Link Instrument Settings box that pops up you will choose Impulse and in the<br />
Start/Repeat Delay you will place a time interval such as 2 seconds. (The purpose of a<br />
points calculation is to have the client learn to sustain activity. It is a very different<br />
measurement than %-over-threshold. As previously explained, you could have a great<br />
improvement on %-over-threshold and yet conceivably never sustain it for quite 2<br />
seconds and thus have 0 points at the end of 3 minutes.)<br />
Now click the number 1 and then under Instrument List choose the instrument to which<br />
you want to link the points. In this case it would be 4-8Hz theta. This will then appear<br />
opposite the #1 on the list of 1 to 5. Now you will, under the word ‘Not’, make a<br />
check mark in the box because you want the client to have a points reward when theta<br />
is NOT above threshold. The word in the column next to this list should be AND.<br />
If you want this link to only allow “Points” to be scored when theta is NOT above<br />
threshold and ALSO when EMG (noise 52-58 Hz) are NOT above threshold then you<br />
must tell it this, at this juncture. To accomplish this you click #2 and under Instrument<br />
List find EMG and it will appear in your list beside the number 2. Check off its box so<br />
that it looks like this:<br />
Not<br />
• 1 √ Theta AND<br />
• 2 √ EMG<br />
At this juncture you will give a Link Output Name such as ‘To 4-8 pts’. (or Inhibit1 in<br />
the new channel set screen an Inhibit2 is the EMG)<br />
2 nd Now you can click the icon for counter in the middle of the menu bar at the top of the<br />
page. Click the page. A box called Counter Settings will appear. You will put in Input<br />
the link instrument that you just made To 4-8 pts. You will give the counter a Counter<br />
Output Name which would logically be 4-8 pts. Now if you right click this new<br />
instrument you can go from top to bottom and adjust the variables on the menu. The<br />
items: Font, Text Color and Background Color are self evident. In Counter Settings<br />
you just have the settings you already filled in when making the instrument. The link<br />
instrument that you made before this dictates which bargraph this counter is linked to<br />
and tells it when to give points.<br />
Copyright ADD Centres Ltd. Prepublication – 1 st draft. Please do not copy. Dr. Thompson 905-803-8066 Canada 77
vii. Enhance Point Counters<br />
You make these counters in exactly the same manner except that you would put an<br />
enhance frequency opposite #1 and this would NOT be checked off. The EMG would<br />
still be checked off. This means that points will be given when SMR is above<br />
threshold and EMG is not above threshold.<br />
It would then appear as follows:<br />
• 1 SMR AND<br />
• 2 √ EMG<br />
This is how the box<br />
would appear.<br />
The SMR Link shows<br />
this box under<br />
instrument settings<br />
←<br />
As noted previously, in the newest channel set this list would have Enhance1, 2, 3, etc<br />
because in this old list you might have changed SMR to a beta channel but the name of<br />
the instrument stayed as SMR which could get confusing.<br />
You can now make counters for any of the instruments you have placed on the screen for<br />
inhibits and enhances. The only differences for enhance bargraph counters is that under<br />
the link instrument settings you would choose an enhance channel such as SMR and you<br />
would NOT put a check mark in the little box under the word ‘NOT’. However, when<br />
you click the number 2 and put in EMG you would click this box because you do not<br />
want a point given if EMG is above threshold.<br />
vii. %-Over-Threshold Counters<br />
Fortunately these are really quite easy to make. Just click the 0.00 numeric icon in the<br />
menu at the top of the page. You are then asked to select Channel. When this appears<br />
go about half way down the list and choose the appropriate virtual channel which in<br />
this case would be *C: Theta % time > C where ‘C’ is a constant that you will decide<br />
upon (probably the mean for theta for that client) when you enter the training<br />
program. Now if you right click this new instrument you can go from top to bottom<br />
and adjust the variables on the menu. The items: Font, Text Color and Background<br />
Color are self evident.<br />
At this point you can enter all the %-Over-Threshold Counters that you would like for<br />
other enhance and inhibit instruments. We suggest that you colour the numbers RED<br />
for inhibit instruments and GREEN for enhance bandwidths because clients easily<br />
understand that RED means STOP or decrease and GREEN means GO or increase.<br />
Copyright ADD Centres Ltd. Prepublication – 1 st draft. Please do not copy. Dr. Thompson 905-803-8066 Canada 78
viii. Labels<br />
Put Labels above each Instrument. This is important because it makes it clear to yourself<br />
and other users exactly what bandwidths you are enhancing and inhibiting. Change these<br />
labels if you change the purpose of the instrument (see note below).<br />
Very Important Note – As previously explained above, when you made your<br />
instruments you gave each of them (including links and counters) an Output Name. You<br />
may, later on in another session, change an instrument’s settings, for example you might<br />
change the channel setting for the 4-8Hz Theta (also the ‘output name’ of the instrument)<br />
bargraph. You could under Set Channels, for example, change the channel from C: 4-8<br />
Hz pk-pk + damper to C: 5-9 Hz pk-pk + damper. However you do NOT under any<br />
circumstances change the Instrument Output Name from 4-8Hz Theta (or Inhibit1 in the<br />
newest channel set). This ‘Output Name’ is the name other instruments, that are linked<br />
together, look for. This name could just as well have been “Tom, Dick, or Harry”. In fact<br />
it probably would be less confusing in the long run to give completely unrelated names to<br />
instruments. The reason I say that is that next time you go into the screen editor you may<br />
have changed the channel from 4-8Hz to 5-9Hz but the name on the bargraph in screen<br />
editor in the upper left hand corner of the instrument is still 4-8 Hz and NOT 5-9 Hz. The<br />
only way to lesson your confusion is to always put the new name in the ‘Label’ box<br />
which you placed ABOVE that instrument when you originally made it.<br />
ix. Animations<br />
Goal: To Have an Animation and a Points Counter that only respond when All Criteria<br />
are Being Met.<br />
First: Have an Animation Linked such that All Criteria Must be Met for it to Move:<br />
Basic Principles<br />
1. All inhibit bargraphs must be made first.<br />
2. Second, all the enhance bargraphs must be made<br />
3. Now you must make 2 Links and 1 Counter before the animation is placed on the<br />
screen.<br />
4. The first link is called Inhibits. Its Link Output Name is ‘Inhibits’. It only<br />
contains inhibits (muscle noise, theta, high beta, etc.) It doesn’t need to contain<br />
enhance frequencies because it is linked to the next link called To AVI which<br />
does that job.<br />
• When you make an inhibit as link you use the OR option. This means<br />
that if any one of the inhibits (muscle noise, theta, etc.) are over<br />
threshold then it will stop the animation.<br />
• There are no check marks beside each of the inhibit frequency bands<br />
because you want the instrument to kick in as “true”. “True” means<br />
that it signals the next instrument in the chain that that these unwanted<br />
bandwidths (inhibits) are above threshold (turned red on their<br />
respective instruments). Thus, ‘true’ for any one of the inhibit<br />
instruments means you want the inhibit link to register it and convey<br />
this message to the next linkage instrument.<br />
• Unlimited means it will have no direct effect on the time duration or<br />
delays for sound feedback<br />
Copyright ADD Centres Ltd. Prepublication – 1 st draft. Please do not copy. Dr. Thompson 905-803-8066 Canada 79
• Start delay: You don’t want any delay on an inhibit because you want<br />
it to kick in immediately<br />
The ‘Inhibits’ link can look like this:<br />
Note that this is what would<br />
appear if you right click the Link<br />
box called “Inhibits” shown on the<br />
far left.<br />
It only has those frequencies that<br />
we wish to act as inhibits. #s 1 &<br />
2 were left open purely by chance<br />
and this does not effect the<br />
instruments performance. We used<br />
the word OR because we want the<br />
animation to stop if any one of<br />
these is above threshold.<br />
In the newest channel set this list would have Inhibit1, 2, 3, etc because in this old list<br />
you might have changed BusyBrain in the above list to another inhibit channel but the<br />
name of the instrument stayed as BusyBrain which could get confusing.<br />
5. The next Link instrument only contains the ‘good guys’ (SMR, high alpha,<br />
problem solving beta, etc.). When you click the link icon and click the screen you<br />
will put under the Link Output Name a name like To AVI Counter.<br />
• This second Link must use the word AND because you want it to only<br />
send a move ahead signal to the animation if all enhance requirements<br />
are met (SMR, high alpha, problem solving beta, etc.)<br />
• None of the enhance frequencies are checked off because this<br />
instrument is to send a true signal to the animation when all the<br />
enhances are positive (over threshold, i.e., ‘true’).<br />
• There is zero start/repeat delay because this signal is to be sent<br />
immediately to the animation.<br />
• It is unlimited meaning it is not to affect the timing of the sound<br />
feedback.<br />
The next link instrument can look like this:<br />
Note that this is what would<br />
appear if you right click the Link<br />
box called “To AVI” shown on<br />
the far left. This is because we<br />
had given this instrument the<br />
name To AVI Counter.<br />
It only has those frequencies that<br />
we wish to act as enhances and<br />
the word AND because we<br />
decided both must be present for<br />
the animation to move.<br />
Copyright ADD Centres Ltd. Prepublication – 1 st draft. Please do not copy. Dr. Thompson 905-803-8066 Canada 80
In the newest channel set this list would have Enhance1, 2, 3, etc because in this old list<br />
you might have changed SMR to a beta channel but the name of the instrument stayed<br />
as SMR which could get confusing.<br />
6. The next instrument is a Counter. [Don’t let the name “counter” throw you off.<br />
Used here this instrument has a different purpose than it does when you are<br />
recording points. It allows animations to receive an input from all the ‘enhance’<br />
instruments through the ‘link’ we just made above. However it also allows an<br />
animation to move forward when these signals are true and backwards when they<br />
are not true (i.e., are below threshold.)] The name you give to this instrument,<br />
Counter Output Name, is ‘To Animation’. This name is entered after you open<br />
“counter settings”.<br />
• The input to this counter is To AVI Counter from the link instrument<br />
of that name (above).<br />
• Reset must have the same attachment to the same Link instrument as<br />
the Input. Thus it too has to AVI Counter as its input. The go-ahead<br />
signal from this link instrument would thus be paralysed by the same<br />
instrument giving a ‘reset’ order unless we do something else. This is<br />
why we check off the box called Inverse Reset Input.<br />
• NOTE: The only way you can make an animation move both<br />
backwards and forwards is to connect that animation to a counter. Note<br />
too that even if you had changed the animation instrument to go both<br />
ways this alone would be necessary but NOT sufficient. You must do<br />
both steps – link it to a counter and tell it to go both ways.<br />
• You must also have the counter instrument set with Reset checked off.<br />
This means that that counter is reset to zero after each incremental step<br />
so that it can then take the next step backwards or forwards as is<br />
required by the linkage inputs (for inhibit and enhance bandwidths).<br />
This is what you would see if you<br />
right click the little black box<br />
called ‘To Animation’ just above<br />
the ball animation. It shows that it<br />
has the link you just made above<br />
To AVI Counter as its input.<br />
• Only now are you allowed to enter an animation. It must be connected to the<br />
Counter Instrument. (It is NOT connected to a bandwidth channel.) You<br />
connect it to the counter instrument called To Animation. (Note that you may<br />
have entered a number of other counter instruments as you were building the<br />
early parts of your display screen. For example, you might have ‘theta points,<br />
SMR points, problem solving beta points and so on.) The ‘To Animation’<br />
counter has its input from To AVI Counter link instrument so it only gets the<br />
Copyright ADD Centres Ltd. Prepublication – 1 st draft. Please do not copy. Dr. Thompson 905-803-8066 Canada 81
“go-ahead” signal if all the enhance band width requirements are being met (all<br />
‘true’, that is, above threshold).<br />
• Click Instrument Settings and choose from one of the many animation displays.<br />
You can see how they will unfold by moving the ruler button below the<br />
animation in the upper left corner of this box.<br />
• Go to Inhibited by and enter Inhibits so that this animation will stop if any one<br />
of the bandwidths in your ‘Inhibits’ Link box should send a signal that it is<br />
‘true’ meaning it is over its threshold.<br />
• Now the animation has the “Go-ahead” signal only if it meets all the<br />
requirements that is, the inhibits are not firing and the enhances are all firing.<br />
• Check off Stretch so that the animation will be an appropriate size within its<br />
own box<br />
• Click Animation Mode and click Threshold dependent. Now click Settings and<br />
set the following:<br />
• Frame rate (you will probably have to reset this after running the screen. 1 is<br />
slow (e.g., a puzzle) and 15 is quite fast (e.g., bowling).<br />
• Cycle (when it reaches the end it starts over again like you want<br />
with bowling but not with a balance beam)<br />
• One way (so the bowling ball doesn’t go both forwards and<br />
backwards. Both ways is good for the ball on a balance beam.)<br />
• The “threshold” box is left at 0.<br />
• Output ON must say Above Threshold<br />
7. The animations zero start delay allows it to respond immediately to the linkage<br />
inputs.<br />
The figure below shows the Instrument Settings that you have now made for this<br />
animation instrument.<br />
Copyright ADD Centres Ltd. Prepublication – 1 st draft. Please do not copy. Dr. Thompson 905-803-8066 Canada 82
Note that its<br />
input is listed<br />
under:<br />
‘Connected to<br />
counter…To<br />
Animation’<br />
which is the<br />
Link<br />
instrument<br />
that you made<br />
above.<br />
Note that the<br />
link you made<br />
called inhibits<br />
is brought up<br />
under the<br />
words<br />
‘Inhibited by’.<br />
Under<br />
Settings we<br />
decided that<br />
the ball<br />
should only<br />
go one way.<br />
x. Sound<br />
8. Now you are ready to enter a Sound. When you click ‘sound’ you can choose<br />
music (Midi songs like “when the saints…”, MP3 files like marching with<br />
drums…, Midi tones or brief signals such as a ding which are contained under<br />
Play Wave files. The ‘wave files’ allow you to give a constant sound or a<br />
proportional sound. Experiment with these in order to understand how they play<br />
out.<br />
• Check off Loop so the sound plays every time you meet criteria<br />
• Set the Interval Time. SMALL GLITCH: This is slightly complicated.<br />
We have found that when we have set, for example, when we set a<br />
counter to give points every 2 seconds that the client meets all criteria,<br />
that the sound needs to be set at 1 second in order to ‘ding’ every time the<br />
this point counter gives another point. But when we do this it works<br />
beautifully. (This may be different with your computer.)<br />
Now, at last, you have an animation that should work. You can appreciate both the<br />
versatility of the program and also why we have tried to save you a lot of time by making<br />
a fairly comprehensive list of screens and a ‘UNIVERSAL DISPLAY’. The ‘Universal<br />
display’ allows you, in a dual monitor setting, to pull off and adapt just those instruments<br />
that will be useful on a particular client’s feedback screen without having to go through<br />
all the these details of screen making. We will go into this further later in this document.<br />
Copyright ADD Centres Ltd. Prepublication – 1 st draft. Please do not copy. Dr. Thompson 905-803-8066 Canada 83
xi. Points Counter<br />
Goal: To make a counter that only gives point when all criteria are met.<br />
Steps<br />
1. Make the Link for the points counter before making the Counter<br />
Under the Link Instrument settings do the following<br />
• Click Impulse (This is necessary for ‘counting’)<br />
• Enter a Start/Repeat Delay. We often use 2 seconds and leave non-responsive at 0.<br />
• Use the Instrument List to enter all the ‘inhibits’. Here we click on the numbers 1,<br />
2, 3, and then highlight the inhibit instrument we want to enter such as EMG (noise<br />
in the EEG 52-58 Hz), 3-10 Hz, BusyBrain (23-35 Hz) and so on. We use the word<br />
AND in the right hand column. We CHECK OFF each of these inhibits<br />
• Now enter all the ‘Enhance’ bandwidths but do NOT ‘CHECK OFF’ these<br />
enhance instruments. (the counter will now not count if any one of the inhibits is<br />
above threshold and will only count if both the ‘enhances’ you entered are above<br />
threshold.<br />
• Enter the Link Output Name. For this we used ‘To All Points’ in our ‘Universal<br />
display’.<br />
Note in particular how the inhibits are<br />
checked off and the enhance band widths are<br />
not checked off.<br />
The word AND tells the counter that all<br />
conditions must be met before a point is<br />
scored.<br />
In the newest channel set this list would have Inhibit1, 2, 3… Enhance1, 2, 3, etc because<br />
in this old list you might have changed SMR, for example, to a beta channel but the<br />
name of the instrument stayed as SMR which could get confusing.<br />
xii. Making a Counter<br />
Under the Counter Settings do the following:<br />
• Enter the Input. This will be the ‘link’ that you just made: To All Points’.<br />
• Enter the Counter Output Name. We called it: ‘All Points’.<br />
• Leave ‘reset’ blank.<br />
On the right hand side you see the Link<br />
instrument that you just made. It is the<br />
Input to the counter instrument (black<br />
box) that has been given a Counter<br />
Output Name of ‘All Points’.<br />
Copyright ADD Centres Ltd. Prepublication – 1 st draft. Please do not copy. Dr. Thompson 905-803-8066 Canada 84
xiii. Making a Spectrum<br />
Click on the 2D Spectrum on the menu bar at the top of the page followed by the channel<br />
*C:FFT 1-sec BUT for one channel EEG do not click on the second channel that<br />
appears after you hit OK to the first FFT. You do not click on the second channel because<br />
this second channel would be used only when you are doing two EEG channel (C & D)<br />
work with a ‘Mind Mirror’. You will get a black and white instrument with the single<br />
spectrum standing vertical. When you click Instrument settings you will see the box<br />
displayed below. Fill out the first box (including making the instrument horizontal) and<br />
then click Set Upper Output Frequencies. You can make your own bandwidth sections.<br />
This is shown in the middle column below.<br />
Then (right hand figure above) you can put in a color for each of your bandwidths in<br />
whatever way looks best for your work.<br />
xiv. Counter Instrument for Bowling Strikes<br />
Steps:<br />
1. Link: Make a ‘link’ instrument. Under the word ‘NOT’ click ‘1’ and put in and check<br />
off Inhibits. (You made the “Inhibits” link above.) Then click ‘2’ and enter 15-18 Hz<br />
problem solving beta but do not check it off. Do the same with ‘3’ entering SMR 13-<br />
15 Hz. Make the Instrument Output Name To Target Counter.<br />
2. Counter Instrument for Targets (see target icon in top row): The “Input” for this<br />
instrument is your last link called To Target Counter. Under ‘target’ controls enter a<br />
number. For our bowling on the ‘Universal’ display screen it required ‘45’ but this<br />
will be different on different computers. Since an actual counter (very small) with up<br />
and down arrows will appear on the screen you can experiment once you have some<br />
data recorded. By experimentation you will find the number that gives one strike each<br />
time the ball rolls down and knocks over all the pins. Make the Instrument Output<br />
Name To AVI Points.<br />
Copyright ADD Centres Ltd. Prepublication – 1 st draft. Please do not copy. Dr. Thompson 905-803-8066 Canada 85
3. Counter Instrument: The Input for this instrument will be To AVI Points and the<br />
Instrument Output Name AVI Points.<br />
xv. ‘Threshold … % > C’ Computations:<br />
When you first get the program it is probably wise to set these at values you commonly<br />
observe with your client population. Doing this will make it faster to turn on screens<br />
and work with clients quickly. If you see a great many young children your values will<br />
be higher than if you see mainly adults. At our centre we see a great many young<br />
children. In ‘edit VC’ save changes to the channel set.<br />
Old Method<br />
We used to go into Channel Set Editor double clicked on the MT EEG Physio… channel<br />
set and then on the fourth icon (calculator) down the left hand side. Here you will see<br />
the words Go to. Enter the number 92 (a virtual channel) and click ‘go to’. You will<br />
see under source 2 on the left, the word Constant. Click this and below it is the same<br />
word ‘constant’ highlighted. Click on this and a box will appear with the C constant in<br />
it. It might be say ‘5’. Change this to whatever number you want. We made it 21.<br />
Click OK. Now go back to the Go to box and enter the next virtual channel (93) and<br />
click Go to and continue the process. When you get to SMR you will enter a much<br />
lower number such as 3 or 4.<br />
To exit hit the icon in the top left corner (door). Now you have constants set permanently<br />
that make more sense. You can still change these for a particular client just before you<br />
get a display screen up and running but sometimes this is too time consuming when<br />
you are attempting to get the interest of a hyperactive autistic child and you want to<br />
start a game quickly but still introduce the parents to the idea of %>threshold.<br />
xvi. Terms<br />
Notes Concerning Some Terms Used in Building Screens<br />
• Start delay refers to how long conditions must be held before the action is<br />
rewarded (e.g., reward smr, without emg or theta, You could enter 0.5 sec or one<br />
or two seconds or whatever time frame delay that you want for that client.<br />
• Duration time must be impulse if a counter instrument is being used<br />
• Unlimited says that it will have no effect on music or beep feedback<br />
• Non response means that the instrument is not to give any more feedback for the<br />
time period (e.g., 2 seconds). This meets Sterman’s criteria of feedback-restrecovery<br />
before another feedback is given. (This is better than older programs that<br />
were locked into beeping every time you went over threshold.)<br />
• Limited means that the reward is for a given duration. (e.g., A move sequence for<br />
10 seconds, if the threshold is achieved, will stop after this time EVEN IF the<br />
client is still meeting the conditions for a reward.)<br />
• Reset Duration only lights up when you have checked off limited and start delay<br />
lights up when you check off unlimited.<br />
• Reset will reset a counter to zero each time it reaches the desired count. (Say want<br />
to sustain a goal for one second. If you sustain the objective for ten seconds it<br />
would normally count to 10. However, if you have checked off reset then the<br />
counter would not proceed to 10, 11, 12 and so on but would reset to 0. Therefore<br />
do not check this off.<br />
Copyright ADD Centres Ltd. Prepublication – 1 st draft. Please do not copy. Dr. Thompson 905-803-8066 Canada 86
Part 5: DESCRIPTION OF SELECTED<br />
DISPLAY SCREENS<br />
For the <strong>Bio</strong>graph-Infiniti Program<br />
Michael Thompson & Lynda Thompson<br />
Preamble:<br />
This section briefly describes how to begin using the <strong>Bio</strong>graph-Infiniti program to run<br />
Neurofeedback / <strong>Bio</strong>feedback sessions with a client using the Thompson (MT) channel<br />
set and selected display screens. This new channel set uses all 254 virtual channels that<br />
are available in the Infiniti program. This initial channel set (others have been designed<br />
for specific purposes, such as 2 channel assessment and training) is designed for one<br />
channel for EEG and one channel for each of 5 peripheral biofeedback variables:<br />
respiration, heart rate, muscle tension, skin temperature and electrodermal response.<br />
The first display screen is used for an assessment profile. The second group of screens (3<br />
screens: biplane, bowling, bags of gold) are primarily for NFB training with children and<br />
adolescents. In the third group (2 balance beams and gorilla & faces which is made from<br />
the 2 balance beam screen) are used for children and adolescents plus adults respectively.<br />
The fourth and fifth screens can be used with all age groups. The fourth screen (skeleton<br />
animation) is used for “shaping” responses; that is, rewarding successive approximations<br />
toward the target levels of particular EEG frequencies. You change the threshold to<br />
increase the challenge over the course of the feedback.<br />
The sailboat screen is used to help the client identify mental states associated with<br />
increasing and with decreasing a specific band-width. The client tries to turn on the<br />
mental state and then let it go and then regain it.<br />
The sixth screen is used for adults. It measures the EEG and all 5 biofeedback variables.<br />
(Any of these variables can be easily deleted and the new screen saved using screen<br />
editor.) For the Procomp2 only one biofeedback variable is used. It must be built into a<br />
specific channel set.<br />
As noted above, we have designed additional channel sets to handle more than one EEG<br />
channel for assessment and training. Many new screens will follow and some of these<br />
will be incorporated into scripts for standardized EEG assessment profiles, stress<br />
assessments, and training. The screens shown below are “the basics”, designed to get a<br />
practitioner up and going and doing competent work with clients.<br />
Copyright ADD Centres Ltd. Prepublication – 1 st draft. Please do not copy. Dr. Thompson 905-803-8066 Canada 87
Assessment, Artifacting, and Teaching Screen<br />
Goal<br />
The purpose of this screen is to observe the raw EEG, remove artifacts in order to have<br />
accurate statistics, and to teach the client (&/or parents) which band-widths correspond to<br />
which mental states.<br />
Instrument<br />
The raw EEG (2-40 Hz) is usually set to 2 seconds or 5 seconds (you can do this at the<br />
top of the screen but I suggest that if it comes to you set for 30 seconds then do the<br />
following: click screens – Edit selected screen in screen editor – click ‘options’ in the<br />
menu bar –time frame - and change this to 5 seconds. Now click ‘screen’ and save.<br />
Henceforth this assessment screen will always turn up with a 5 second span.). Below this<br />
is a multi-line graph so that you can compare the relative amplitude of various band<br />
widths. When you are collecting data the program averages the last one-second of data<br />
and displays it as a spectrum at the bottom of the screen. In addition, the average (to the<br />
number of seconds the display has been running) micro-volt numbers for selected band<br />
widths and ratios is displayed on the right hand side of the screen. An additional short<br />
line graph, just below the EEG, shows 52-58 Hz activity. This gives you a good estimate<br />
of EMG noise which may be affecting your EEG readings.<br />
Note 1: If you exit the program and reenter using the Data option then you can review the<br />
data to artifact it and teach clients (and/or parents) how bandwidths correspond to mental<br />
states. The spectrum at the bottom of the screen reflects the one-second of EEG data<br />
immediately to the left of the red line which lies at the right of the screen until you move<br />
it with the mouse.<br />
Note 2: When you hold down the shift key and left click the mouse while drawing it<br />
across (shading) an area of the EEG you will be given several options. One of these is to<br />
immediately see statistics for that shaded area. These are in microvolt magnitude values<br />
for a set of clinically meaningful bandwidths for the area that you have marked.<br />
Procedure<br />
At the ADD Centre (<strong>Bio</strong>feedback Institute of Toronto) we look at this screen for 30 to 40<br />
seconds at the beginning of every session. In this manner we are able to make sure that<br />
we have a good EEG recording. Also, we can remind the client of how their EEG pattern<br />
reflects their mental state and the difficulties that they are trying to overcome. This is a<br />
reminder of their clinical or educational goals and what they want to accomplish in terms<br />
of changing their mental state and, thereby, the observed EEG. We remind them that the<br />
EEG is nothing more than a flag. A flag that reflects what their brain is doing at any<br />
instant in time. A flag that is a tool for them to use as a guide to help them practice<br />
sustaining mental states that will optimize their own performance.<br />
This Assessment screen has a threefold function.<br />
I. Assessment: To assure that sufficient data without artifact is being collected, the<br />
trainer / clinician, in the initial assessment, can use this screen while the client is<br />
carrying out each of the data collection conditions (eyes open (EO, eyes closed (EC),<br />
Copyright ADD Centres Ltd. Prepublication – 1 st draft. Please do not copy. Dr. Thompson 905-803-8066 Canada 88
eading, and math). The trainer is then able to do statistics separately for each<br />
condition.<br />
II. Artifacting: While reviewing the data the trainer can hold down Ctrl and left click<br />
while dragging the mouse across the data to mark it because it contains an artifact and<br />
should be excluded from statistical calculations. (It turns gray.) We usually have the<br />
client blink before recording and sit comfortably and still while we are recording.<br />
Most of the record, under these circumstances, will be artifact free. For details on<br />
Artifacting see The Neurofeedback Book (www.AAPB.org).<br />
The 52-58 Hz EMG noise line below the EEG helps you distinguish muscle artifact from<br />
high beta neuronal activity. (52 Hz is above desirable 39 - 41 Hz “Sheer rhythm”<br />
activity and will also avoid 50 Hz or 60 Hz electrical noise.<br />
The spectral array will help the trainer distinguish low frequency movement artifact from<br />
3 Hz theta activity.<br />
It is important to note again that the spectral array only reflects the one second of EEG<br />
activity to the left side of the red line.<br />
III. Teaching: One of your most important objectives is to help your clients understand<br />
the EEG pattern and its possible meaning in terms of mental state changes. The<br />
spectral array and the microvolt boxes above it help you to do this. For example, in a<br />
child with ADHD you might observe very high amplitude slow wave activity around<br />
3-5 Hz. The client, at these points, may be internally distracted and not attending to<br />
what you are saying or what they are supposed to be reading. If you have observed<br />
and marked the times (click the space bar and a marker will appear on the screen) when the<br />
client appeared to drift off (eyes may seem to ‘glaze’ over) then this may confirm<br />
your observation and be helpful to parents or client in understanding the EEG. You<br />
may also observe that an impulsive client may have a dip in the EEG magnitudes<br />
between 13 and 15 Hz. This may reflect low sensorimotor (SMR) activity. On the<br />
other hand, in a highly stressed adult client who ruminates you might observe a<br />
marked peak in hi-beta activity somewhere between 23 and 34 Hz. You can observe<br />
these dips and blips in the record and suggest that your client experiment by trying to<br />
find mental states that would increase them and, alternatively, decrease them so that<br />
they could identify for themselves the mental-state-meaning of these dips and blips in<br />
their record. The sailboat screen can be helpful in this regard.<br />
Thresholds for Feedback Screens:<br />
As previously suggested above, we recommend that in your first session you print out the<br />
statistics from your first 30 second recording of the EEG and use the microvolt means<br />
thus obtained for such band widths as: delta-theta (3-7 Hz), theta (4-8 Hz), 3-10 Hz, SMR<br />
(13-15 Hz) and problem-solving-beta (15-18 Hz) and so on, for the threshold % >C<br />
values in Channel Set. In addition we suggest you use these same values as your initial<br />
thresholds for bargraphs on the feedback display screens.<br />
Copyright ADD Centres Ltd. Prepublication – 1 st draft. Please do not copy. Dr. Thompson 905-803-8066 Canada 89
Newest version of the Assessment Screen showing theta.<br />
Cz referenced to the Left ear on the old screen version to show alpha<br />
Copyright ADD Centres Ltd. Prepublication – 1 st draft. Please do not copy. Dr. Thompson 905-803-8066 Canada 90
The above assessment screens show an 11 year-old child who displays peaks in both theta<br />
(note the theta/beta ratio in the first figure) and very high amplitude bursts of low alpha in<br />
the second display. On either of these occasions, his eyes seem to glaze over and he does<br />
not recall the material he is reading.<br />
Notes for all screens to save you frustration:<br />
(1) Any screen (such as ‘darts’ and ‘skeleton’) where the object goes both forwards and<br />
backwards, you can change it to only go forwards. To do this click Screens -Edit<br />
selected screen in screen editor – right click over the instrument you want to change<br />
(e.g., dart, click settings (right side) and change it to ‘one way’. Save your changes.<br />
(2) Most screens have too much information on them. CHANGE THIS! Either use<br />
‘view – hide instruments’ (described previously) and click over any item and then click<br />
highlight and that instrument will have a red rectangle around it. You don’t lose it by<br />
checking the box, it disappears only until you uncheck that box. OR, even better, attach<br />
a second monitor and in screen editor just pull over the instrument(s) you want and<br />
enlarge them on the client’s screen.<br />
(3) On some screens such as B3-1D you really MUST ADJUST things to fit a particular<br />
client. On this screen you do this by changing the inhibit and enhance bar graph channels<br />
and the %>C channels that sit beside them and the wording in the label above each. You<br />
also change the channels that are being used in the inhibit and enhance columns on the<br />
right hand side of the trainer monitor so that they reflect the banc widths that that<br />
particular client should be using for inhibit and enhance.<br />
(4) You must make an adjustment on any screen that has a counter (as with ‘strikes’<br />
below) with a small print little white rectangle and tiny up and down arrows on its right<br />
side. You must adjust this number in order that the counter counts at the rate it should<br />
count at. For example, on the screen shown below, it should only register a strike when<br />
the ball knocks over all the pins.<br />
Copyright ADD Centres Ltd. Prepublication – 1 st draft. Please do not copy. Dr. Thompson 905-803-8066 Canada 91
Child Screen<br />
Bowling<br />
Goal:<br />
To encourage the child to simultaneously meet three basic criteria. These are often to:<br />
externally focus (decrease 3-7 Hz theta activity), decrease impulsivity and fidgeting<br />
(increase 13-15 Hz SMR activity) while holding muscle (EMG) noise at a low level so<br />
that you don’t get a false idea of raised SMR or beta activity.<br />
Instrument:<br />
This instrument is simple and easily understood even by young children. Green always<br />
means good. On the other hand, red always means that you are not meeting the criteria<br />
and points will not be scored. Children relate this to green lights which mean its OK to go<br />
and red lights that mean stop. Thus the theta bargraph on the left side is red when the<br />
child is above threshold and green when below. If the child focuses (externally) then this<br />
bargraph will go down below its threshold line and the bargraph colour will turn green. If<br />
SMR is above its threshold and EMG noise below then all three bargraph instruments are<br />
green and the bowling ball moves and music plays. If any instrument turns red meaning<br />
that its threshold is not being met, the music and the ball both stop.<br />
There are two counters. One is for strikes (every time the ball knocks over the pins). The<br />
other counter gives one point every two seconds that all three criteria are sustained. This<br />
second counter is similar to other instruments, (You can change it to a different time<br />
frame in screen editor if you wish.) This counter makes more sense than counting<br />
“strikes” if you decide to change the instrument animation from bowling to another<br />
animation such as ‘picking-up-bags-of-gold’ or the juggler or a puzzle.<br />
Copyright ADD Centres Ltd. Prepublication – 1 st draft. Please do not copy. Dr. Thompson 905-803-8066 Canada 92
How to Make Many More Similar Screens:<br />
It is very simple in the Infiniti program to change the instrument or animation. This is<br />
done by clicking screens then Edit selected screen in screen editor. Now right click over<br />
the bowling animation and highlight the new animation that you would like to use from<br />
the list that pops up. You will also see that you have choices as to whether the animation<br />
goes only one way or both backwards and forwards. You can also choose to have it cycle<br />
(start over again when it reaches the end like bowling does). The frame rate is useful if<br />
you want to slow down or speed up an animation. Click OK and then you might right<br />
click over the word “strikes” and delete it. You might also delete the number box for<br />
number of strikes and just leave the points-per-2 seconds-sustained activity on the screen<br />
as your one reward counter. When you are finished remember to click save as and give<br />
your new screen a new name. In this way your old bowling screen will still be there and<br />
all you have done is add a new screen that you can use. When you click exit the program<br />
closes screen editor and you are back in the training program but on your new screen.<br />
The ‘biplane’ screen (Really a Triplane) and the bags of gold screen for children are<br />
shown below. They are somewhat simpler because they do not have the %-over-threshold<br />
boxes or points for each variable. They do, however, have points for meeting all criteria<br />
in the bottom left hand corner.<br />
Copyright ADD Centres Ltd. Prepublication – 1 st draft. Please do not copy. Dr. Thompson 905-803-8066 Canada 93
The screen below is similar in its simplicity but it is more suitable for older clients and<br />
has therefore now been place under the list of “universal” screens. It comprises a series of<br />
pictures of Venice that morph one into the other as one progresses.<br />
Copyright ADD Centres Ltd. Prepublication – 1 st draft. Please do not copy. Dr. Thompson 905-803-8066 Canada 94
iii. Shaping with Skeleton Screen<br />
Goal:<br />
The emphasis for the client in this neurofeedback screen is on focus.<br />
Instrument:<br />
The goal is to improve external focus thus the 4-8 Hz bargraph is larger than the others.<br />
The SMR bargraph is only present for the trainer to observe. The 52-58 Hz bargraph is<br />
there to inhibit all feedback when there is facial, scalp or neck muscle tension. If the<br />
trainer is consistent in setting the same threshold at each turn of the skeleton in the<br />
shaping procedure (below) then points (4-8 Hz) will be meaningful both within sessions<br />
and between sessions but only for this screen because points are linked to the threshold<br />
that you are changing. The % above threshold counters for 4-8 Hz and SMR are<br />
independent of the threshold setting on the screen. As previously mentioned, they are set<br />
before you enter the games by clicking on Edit Visual Channel Settings and setting the<br />
Delta-Theta % >C (constant).<br />
We usually set this constant at the mean for the bandwidth in question in the first session<br />
for each client. For delta-theta (3-7 Hz) or theta (4-8 Hz) the client attempts to get the %<br />
lower than 50% and gradually improve on that until it is around 30%. At that juncture we<br />
will usually change the constant to make it harder and record in the client’s chart that we<br />
have done this. (The value you set becomes the new %>C for that band-width for that<br />
client.)<br />
In the above screen note that the %-above-threshold for theta is 96.39. This is an ‘alarm<br />
bell’ for the trainer telling them to stop feedback and enter the channel setting option to<br />
change the C:theta % >C to a higher level (this child’s mean for theta on the initial 40<br />
second assessment at the beginning of the session.)<br />
Copyright ADD Centres Ltd. Prepublication – 1 st draft. Please do not copy. Dr. Thompson 905-803-8066 Canada 95
Procedure:<br />
The screen is set up so that the animation is ONLY linked to 4-8 Hz theta. The trainer<br />
“shapes” the client’s behaviour by gradually making the threshold setting more difficult.<br />
This can be done most easily and accurately by clicking the theta bargraph to ‘highlight’<br />
it (a reddish outline around the edges of the rectangle) and then by using the “Th1 ”ٱ box<br />
at the top of the screen to change the threshold. We suggest that the trainer make it very<br />
easy for the skeleton to move across to the left side of the screen and make its first turn.<br />
Then lower the threshold to make it a bit harder. When the skeleton reaches the right side<br />
and turns the trainer lowers the threshold further to make it even harder. When the<br />
skeleton reaches the left side and turns to come towards the boy then the trainer makes it<br />
very hard so the skeleton is only moving forward slightly more than 50% of the time in<br />
the initial trial. Make sure you mark down each of these thresholds on the client’s chart.<br />
Mark down how long it takes for the skeleton to completely leave the screen. Challenge<br />
clients at this point to beat their last time.<br />
iv. The Sailboat Screen:<br />
Goal:<br />
The goal for the client is to “feel” or “sense” the difference between theta (4-8 Hz) being<br />
high versus being low.<br />
Instrument:<br />
The largest bargraph is for Theta (4-8 Hz). The sailboat animation and the sound is<br />
ONLY linked to theta. Initially set the bargraph threshold so the client would ordinarily<br />
be above it 50% of the time. The SMR bargraph is only present for the trainer to observe.<br />
The 52-58 Hz bargraph is there to inhibit all feedback when there is facial, scalp or neck<br />
muscle tension. The red bar in the spectral histogram allows the client and trainer to see<br />
where most of the high amplitude activity is between 4 and 20 Hz.<br />
Copyright ADD Centres Ltd. Prepublication – 1 st draft. Please do not copy. Dr. Thompson 905-803-8066 Canada 96
Note: This screen can be altered by changing the theta bargraph to another bandwidth<br />
which should be decreased. For example, the bandwidth might be changed to 20-22 Hz or<br />
23-32 Hz because a client demonstrated very high peaks in one of these areas (reference:<br />
The Neurofeedback Book, Michael Thompson and Lynda Thompson pages 162, 284, 307<br />
– available through www.AAPB.org). This is done by clicking screens then Edit selected<br />
screen in screen editor then right clicking the theta bargraph and clicking set channels<br />
and selecting either intensity pk-pk + damper or BusyBrain pk-pk +damper (or another<br />
band-width that you wish to depress). Now change the spectrum at the bottom of the<br />
screen. Right click the instrument then click Instrument Settings. In Instrument Settings<br />
change the minimum frequency to 9 and the maximum to 34 Hz. (You will eventually<br />
encourage the client to keep the red maximum amplitude in the 11-15 Hz range.) Then<br />
click screen and save as and give the screen an appropriate change of name. Now click<br />
close and you will be back to your feedback screen.<br />
Note also that the theta/beta ratio line in the above screen is flat. The trainer should<br />
immediately recognize that the scale on the y-axis is incorrect. It can be modified by<br />
clicking over the instrument and changing it (top of the screen). However it should be<br />
permanently changed by entering the screen editor.<br />
Procedure:<br />
Ask the client to raise the amplitude of theta (the boat breaks up) and then to purposefully<br />
lower it and feel the difference between these two mental states. Repeat it many times in<br />
order to gain a self-regulatory control.<br />
We now often prefer to use a second monitor for a client screen and just pull over the<br />
theta bargraph and enlarge it.<br />
Copyright ADD Centres Ltd. Prepublication – 1 st draft. Please do not copy. Dr. Thompson 905-803-8066 Canada 97
v. The 3-7 or 4-8 Hz, 13-15 Hz Balance-Beams Screen and<br />
Variations for Children<br />
Goal:<br />
To improve ability to both sustain a calm mental framework and focus externally.<br />
Instrument:<br />
The top 1/3 of the screen addresses a calm but alert mental state which may be achieved<br />
by raising (%-over-threshold) and sustaining SMR 13-15 Hz (points reflect sustaining<br />
activity for 2 seconds in this screen).<br />
EMG noise, (52-58 Hz) bargraph is there to inhibit all feedback when there is facial,<br />
scalp or neck muscle tension. Beside this bargraph is a linegraph showing EEG RAW.<br />
Many of our young clients like to read the EEG rather than watch the bargraphs. They are<br />
very fast and accurate in this endeavour. With adults we often move to the screen editor<br />
and change the set channels on this instrument in order to have this line graph record raw<br />
respiration. This can be very effective helping the client to relax. (Don’t forget to use<br />
save as and save the screen with a new name if you make this kind of change.)<br />
The bottom 1/3 of the screen addresses sustaining an external focus which may be<br />
achieved in most children and about ¾ of your adult clients, by lowering the dominant<br />
slow wave activity which may be in the THETA range. You will have noticed that we use<br />
the term “external focus”. This is done to recognize that we constantly go into theta to<br />
lay down and to retrieve information. However most ADHD clients go into theta and<br />
often just seem to stay there. In that state they will stop registering new information from<br />
the external world (speech, reading, etc.). Thus, it is not that they go into theta or thalpha<br />
that is the problem, it is that they appear to sustain that state when it is inappropriate.<br />
About 1/4 of your adult clients (and about 7% of your child clients) may not tune out in a<br />
slow wave area between 3 and 10 Hz. These clients may have what we have termed a<br />
Busy Brain. They may show peaks (bursts) between 23 and 35 Hz which correspond to<br />
them being busily involved in their own head. Often, with your client population, this<br />
represents circular non-productive, ruminating. You can, in these cases, change the<br />
bargraph for this instrument from Theta to ‘BusyBrain’ in the screen editor under Set<br />
Channels.<br />
A very small number of clients may show Beta Spindling (narrow band width,<br />
synchronous, high amplitude waves) at a lower beta frequency. For a client who is very<br />
hyperactive and needs to raise SMR 12-15 Hz but who also has sudden bursts of<br />
extremely high amplitude beta spindling at, say, 14-15 Hz, you would have to change the<br />
frequency of SMR to 12-15 and the frequency of the ‘Inhibit’ to inhibit high amplitude<br />
bursts of 12-16 Hz. These changes can be made by changing one of the channels (just for<br />
this child) to cover the beta spindling. You alter the channel connections for the<br />
instruments by using screen editor (as described above).<br />
Important: As previously explained, a client could achieve a great improvement in the<br />
%-Above Threshold rating but achieve very few points. Points require the student to<br />
sustain the activity for a set period of time. (1,2 or 3 seconds usually.) It is set here for 2<br />
seconds.<br />
Copyright ADD Centres Ltd. Prepublication – 1 st draft. Please do not copy. Dr. Thompson 905-803-8066 Canada 98
Procedure:<br />
When you enter the screen, as with other screens that contain bargraphs, set the threshold<br />
of the bargraphs to the mean that you found earlier for that bandwidth. It is almost (a little<br />
easier) the same mean that you used to set threshold >C. The exception to this is the<br />
EMG noise bargraph. This is set a little higher so that the feedback is not constantly<br />
stopping but will stop should any major movement or muscle tension occur.<br />
Note: In screen editor the “To SMR” and “To Theta” control linkage icons are hidden<br />
under ‘SMR’ box and ‘Theta AVI’ animation respectfully. These are linkage icons that<br />
allow you to right click and reset the time length to, say, one second or 3 seconds. Just<br />
left click and hold down the mouse left button and move the box in question to reveal the<br />
hidden linkage icon. Now right click the linkage icon (a 3-link chain) to get a menu and<br />
left click Instrument Settings and reset the Start/Repeat Delay box to the number of<br />
seconds you want between points.<br />
Try making a variation on this screen as is shown below. Some children like this<br />
variation. They make the ball roll to the left and the head on the left grow large. The<br />
frame rate is set quite low so that it is a slow and gradual change and the child receives a<br />
token when it is completed. Again note, in the example shown below, that the trainer<br />
must immediately exit and change the C: Theta %> C to this child’s mean.<br />
Again, the trainer should immediately see that the % above threshold for theta (red,<br />
96.79%) is j too high and the constant (C.) must be reset to a higher level.<br />
Copyright ADD Centres Ltd. Prepublication – 1 st draft. Please do not copy. Dr. Thompson 905-803-8066 Canada 99
The Marching Mouse<br />
Below is another screen variation that children like. The trainer can manipulate the<br />
thresholds so that the mice appear to be in a race. We put one of the mice on marching<br />
music.<br />
The music used for this screen really catches the client’s enthusiasm. You can manoeuvre<br />
the top mouse threshold so that you make a ‘race’ out of it.<br />
Copyright ADD Centres Ltd. Prepublication – 1 st draft. Please do not copy. Dr. Thompson 905-803-8066 Canada 100
vi. Adult Single Monitor EEG and <strong>Bio</strong>feedback<br />
PI MT Physio Monitoring….scr<br />
This is an Adult Screen<br />
Goal<br />
The purpose of this screen is to optimize performance and learn to make a rapid recovery<br />
from stress. The client is to sustain a calm, relaxed yet alert, focused problem solving<br />
mental state.<br />
Instrument:<br />
There are 3 major bargraphs on this instrument: 13-15 Hz, 19-22 Hz, and 23-34 Hz.<br />
There is also an EMG noise inhibit bargraph 52-58 Hz.<br />
In addition important biofeedback (physiological variables) instruments are included.<br />
There are line graphs for respiration and heart rate and a spectrum for the EEG.<br />
Respiration is a very thick blue line and the heart rate is a thinner red line. The purpose of<br />
these line graphs is to clearly observe RSA (respiratory sinus arrhythmia). The default<br />
time is 30 seconds. On the right hand side there are boxes for: heart rate, breaths per<br />
minute, skin temperature, muscle tension and a small bargraph for electrodermal<br />
conductance. Thee is also a square that changes colour from red to green as the client<br />
moves below an EMG threshold that you set. The EDR bargraph has a threshold line and<br />
an obnoxious sound will be emitted if the client drops below that threshold. (You can<br />
change the threshold for each client. You can also go into screen editor and change the<br />
sound for that instrument.)<br />
Procedure:<br />
We always have the client watch respiration first. When the client is breathing<br />
diaphragmatically at about 6 breaths per minute there will be 3 clear ‘mountains’ across<br />
the 30 second line graph. The red pulse rate line should rise and fall in parallel with the<br />
thick blue respiration line (inspiration and expiration) demonstrating RSA. When this is<br />
going well ask the client to observe muscle tension and decrease it. Clients find it easiest<br />
initially to think of releasing all muscle tension and warming their hands as they expire.<br />
Often clients will say that they start feeling sleepy when they practice relaxing. We note<br />
that this is the opposite of what they are trying to accomplish most of the time. They need<br />
to relax but remain very alert when at work or driving. Thus through the entire session<br />
they have to keep their EDR (electrodermal) at a high level for them (individual to each<br />
person). This should correspond to being very alert. For this reason we have an<br />
obnoxious tone sounding when the client’s EDR drops below the threshold that you have<br />
set for them.<br />
When these biofeedback variables are under control then we suggest the client lower the<br />
amplitude of the BusyBrain (called “Ruminations” in this screen, 23-34 Hz) bargraph. A<br />
relaxed open awareness state will help them achieve this. We may switch this to a more<br />
precise frequency range dependent on their assessment. While doing this the SMR<br />
bargraph should rise. Finally they will add lowering the intensity (19-22) Hz range to<br />
their goal.<br />
Copyright ADD Centres Ltd. Prepublication – 1 st draft. Please do not copy. Dr. Thompson 905-803-8066 Canada 101
For some clients we change the 19-22 Hz bargraph to thalpha (6-10 Hz) if this seems<br />
more appropriate considering their assessment. We also make another screen where SMR<br />
(13-15 Hz) is changed to problem-solving-beta (15-18 Hz) and have them learn cognitive<br />
strategies while maintaining high 15-18 Hz and low 23-34 Hz activity. With some clients,<br />
such as athletes, who are attempting to optimize performance, we will change the 13-15<br />
Hz band to 11- 12 Hz (high alpha) and encourage an open awareness state.<br />
D1-3 Intensity Calm BFB screen – The room was very very cold – this does affect skin<br />
temperature. The % time> thresholds must all be reset. The scale on the screen for SMR<br />
should be made lower. This is a 66 year old and after a period of training heart rate did<br />
get in synchrony with respiration.<br />
This adult client demonstrated a high ratio of 23-34 / 13/15 Hz. She worried (ruminated)<br />
a great deal. In the above screen you can see that she has now got control of her breathing<br />
which has dropped from 18 BrPM to 7 breaths per minute and she is now showing some<br />
synchrony with heart rate.<br />
Forehead muscle tension has dropped from EMG at 7.15 to 1.84. These changes<br />
coincided with a gradual but consistent decrease in high beta and an increase in SMR<br />
(which is very low in the above example) and high-alpha.<br />
Note that in all screens, the bargraphs always use …pk-pk + damper channels. The<br />
damper is usually set (Set Channels) at 5. The damper will slow down the vertical<br />
movements of the bargraph so that it is helpful (not a distraction) to the client.<br />
Copyright ADD Centres Ltd. Prepublication – 1 st draft. Please do not copy. Dr. Thompson 905-803-8066 Canada 102
vii. Heart Rate Variability (HRV)<br />
The screen that is specific to this is shown below.<br />
This is one of our most frequently used adult screens. The adults start their session using<br />
this screen to help them get perfect synchrony between heart rate variations and their<br />
breathing as is shown above.<br />
The yellow area is mostly influenced by the sympathetic system and the green by the<br />
parasympathetic system. The purple delineates the area we want to see high amplitude. It<br />
correlates to a balance between sympathetic and parasympathetic systems.<br />
A frequency of 0.1 is derived by dividing the number of cardiac variation cycles in<br />
one minute by 60 (seconds) to give the rate per second. Thus 6/60 = 0.1 cycles per<br />
second. This is a good rate to aim for with most clients. (Breathing rate between 5.5 and 7<br />
breaths per minute is usually a good goal. However, the client must never “over-breathe”.<br />
Over-breathing is the opposite of relaxed “effortless” breathing. Over-breathing<br />
(hyperventilation) is a potentially serious side-effect that may be avoided by emphasizing<br />
that breathing should effortless, comfortable and the next breath should only be taken<br />
when the ‘need’ is felt by the client. If the reader is doing this work with clients they<br />
would be well advised to review the literature on this subject. (Over-breathing can result<br />
in the client feeling anxious and depressed. At an extreme it can lead to the precipitation<br />
of angina or a seizure.)<br />
Their average HRV amplitudes in the purple bargraph usually go over 10. Older subjects,<br />
however, are often closer to 6 or 7. The HRV % of total power shows most of the power<br />
in the purple bargraph.<br />
Copyright ADD Centres Ltd. Prepublication – 1 st draft. Please do not copy. Dr. Thompson 905-803-8066 Canada 103
viii. Alpha Theta<br />
Three screens are included. The main difference is in the sounds that are employed. In the<br />
end, you will choose the appropriate sound(s) with your client.<br />
This screen has the option of only having a water sound when cross-over is being<br />
sustained. Alternatively we use the running stream sound when theta is up and continuous<br />
bird sounds when there is ‘cross-over’. The line graph in the centre of the screen allows<br />
the trainer to follow 5-7 theta in orange, 8-10 alpha in green, and 13-15 beta in blue.<br />
The client wants to sustain a state where they just maintain the crossover so that theta is ><br />
alpha but it does not go down too far and they fall asleep. We suggest you read the<br />
chapter in the Neurofeedback Book by M. Thompson & L. Thompson (available through<br />
www.AABP.org bookstore or on Amazon.)<br />
Copyright ADD Centres Ltd. Prepublication – 1 st draft. Please do not copy. Dr. Thompson 905-803-8066 Canada 104
ix. Dual Monitor Screens<br />
Note: In the new Infinity program, any screen can be turned into a dual<br />
monitor screen.<br />
Goal<br />
To give the client only what is essential for a particular session while still allowing the<br />
trainer to monitor all the other psychophysiological parameters.<br />
Instrument<br />
In order to meet the above goal the program must allow a rapid change in a screen. The<br />
infinity program meets this requirement by allowing the trainer to choose a screen, for<br />
this example we took a one monitor screen for darts, then click Screen and edit …. The<br />
trainer then places the mouse over the right edge of the screen and drags it across the<br />
second monitor. The trainer can then right click and drag whatever instrument is<br />
important for that session on to the “client’s” monitor. In this example we dragged the<br />
dart game over to the second monitor. We then would put this second monitor in front of<br />
the client. We enlarged the game so that it filled the screen.<br />
Note: In order to do this you may have to alter your windows program so that it will<br />
extend to a second monitor. In order to do this, click start and ‘settings’ then enter<br />
‘control panel’, display, and settings as described previously and click the second<br />
monitor. Check the box that tells Windows to allow you to extend the screen on to a<br />
second monitor.<br />
Now you click ‘apply’ and then OK. Now, in the Infinity program’s screen editor you can<br />
click the right side of the screen and when you get a double arrow you can hold the<br />
mouse button down and drag the edge of the screen across the entire second monitor. You<br />
will only see the ‘background’ colour on the second screen at this juncture. At this point<br />
you left click any item on the left (original) monitor and hold the mouse button down and<br />
drag that item across to the client’s screen. In this example we dragged the dart animation<br />
across to the client’s screen.<br />
Copyright ADD Centres Ltd. Prepublication – 1 st draft. Please do not copy. Dr. Thompson 905-803-8066 Canada 105
TRAINER’S SCREEN / CHILD’S SCREEN<br />
Then, we decided that it would be good to have the raw EEG and a spectrum on the<br />
trainer’s monitor so these instruments were added (see Editing screens above).<br />
TRAINER’S SCREEN / CHILD’S SCREEN<br />
After experimenting with it we decided that we would like to have points for meeting all<br />
conditions on the screen to provide a little more motivation for the client (not shown).<br />
We therefore dragged the points (see the box with ‘All’ above) across to the client’s<br />
screen. Thus, in addition to trying to hit the target, a child would be challenged to<br />
increase the points for meeting all conditions. At the end of each 3 minute segment we<br />
would graph the points, % above threshold, and the microvolt values for theta and SMR<br />
and give extra tokens for improving these.<br />
With some computers this progression may not always work as well as it should. The<br />
EEG and spectrum may have brief pauses from time to time. This motivated us to make a<br />
‘Universal’ screen where the instruments were entered in the correct order and virtually<br />
any new dual monitor instrument could be made.<br />
THESE ARE DESCRIBED LATER<br />
Copyright ADD Centres Ltd. Prepublication – 1 st draft. Please do not copy. Dr. Thompson 905-803-8066 Canada 106
x. Dual Monitors Assessment Screens<br />
A number of variations, using a second monitor, have been made with the assessment<br />
screen. You can make your own. Here are a couple that people find useful for seeing<br />
more clearly over time, (3D), bursts of waves such as high frequency spindling beta.<br />
They are also useful for watching how one frequency may inversely covary with another.<br />
For example, high amplitude high frequency beta may correlate with low SMR. Bursts of<br />
problem solving beta(15-18 Hz) may correlate with a dip in low frequency beta (3-5Hz)<br />
or with alpha (8-12Hz). We have even had requests to put respiration and heart rate on<br />
this screen as can be seen below.<br />
This is in the data review mode. The cursor on the EEG corresponds to the white ‘wall’.<br />
Copyright ADD Centres Ltd. Prepublication – 1 st draft. Please do not copy. Dr. Thompson 905-803-8066 Canada 107
In the above a spindle of beta is seen at 29 Hz in the 2D spectrum. If we move the cursor<br />
to the left of this burst on the raw EEG then it can be seen in the 3D spectrum as shown<br />
below.<br />
The 3D spectrum really highlights brief bursts of high amplitude waves. Have your client<br />
mark when their mental state really shifts. The client can use a hand signal or make a<br />
little mark with a pencil. When they signal you write down the time. Then you can review<br />
that EEG record with the client and see what EEG changes actually occurred when their<br />
mental state changed.<br />
This dual monitor assessment screen really makes reviewing the EEG ‘come alive’ for<br />
your client.<br />
Copyright ADD Centres Ltd. Prepublication – 1 st draft. Please do not copy. Dr. Thompson 905-803-8066 Canada 108
xi. F Screens<br />
These screens emphasize Self-Regulation and Control. The exercise is simple to<br />
understand and very difficult to do. The client is to raise the blue filling in the bargraph<br />
above the threshold – hold it there – then lower it below the threshold and hold it there.<br />
If they can do this they then try to consciously relate the mental state that will put it<br />
above the threshold line and the different mental state that will put it below the line. For<br />
example, if the bargraph was on 3-10 Hz it is quite likely that going into an internal<br />
wandering day-dreaming state the bargraph might rise above the threshold line. It is also<br />
possible that becoming singularly externally focused on something that the bargraph<br />
might drop below he threshold line.<br />
TRAINER SCREEN<br />
CLIENT SCREEN<br />
The client has held the bar above threshold for 20.5 seconds (score of 41). Now he will<br />
hold it below threshold for the same length of time and attempt to distinguish the<br />
difference in the two mental states.<br />
These screens are used early with an adolescent or adult client (use the sailboat screens<br />
for he same purpose for children)<br />
xii. Dual Monitors THE ‘UNIVERSAL’ SCREENS<br />
The “Universal” Trainer Screen<br />
Goal<br />
1. To have a basic display on two monitors which would contain all the major<br />
instruments. This display would include: instruments for measuring all the biofeedback<br />
modalities such as Respiration, Pulse, RSA, EDR, Temperature, and EMG and all the<br />
necessary EEG instruments such as the raw EEG, spectrums both 3D and 2D, EEG<br />
bandwidth measurement instruments (such as bargraphs) with point counters and % ><br />
threshold for each, and an animation display with points for meeting all EEG criteria.<br />
2. To teach trainers how to use the Universal Display to create new dual monitor<br />
displays. On one monitor in the display are the instruments that are most useful for a<br />
Copyright ADD Centres Ltd. Prepublication – 1 st draft. Please do not copy. Dr. Thompson 905-803-8066 Canada 109
particular client. On the second monitor are all the other instruments. In this way all the<br />
parameters that are not on the client monitor are still available for the trainer to follow as<br />
needed.<br />
Instrument<br />
The UNIVERSAL display has been made with the sole objective of making your life a<br />
little easier.<br />
All the instruments have been put on this display (2 monitors) in the correct order with<br />
the correct linkages and counter instruments. This means they should work without<br />
delays and glitches. You can make simple changes in any of the instruments. For example<br />
you can change the channels. However, please always use an enhance instrument when<br />
you wish to change to a different enhance bandwidth and use an inhibit instrument to<br />
change to a different inhibit bandwidth. You can change the bandwidths on the spectrums<br />
and change their colours. You can change the animation – there is a wide range of<br />
choices available under instruments in the screen edit mode.<br />
But we remind you, do NOT change the name of any instrument. Change only the ‘label’<br />
(a separate ‘instrument’) above the instrument where you changed a channel bandwidth.<br />
THE UNIVERSAL DUAL MONITOR SCREENS<br />
When you look at the pictures below think of the one picture as representing two<br />
separate monitors. The basic ‘Universal display’ has instruments spread over two<br />
monitors. The screens that are made from this ‘‘Universal display’’ have the trainer’s<br />
monitor on the left. This has been done so that trainers can use a small lap-top computer<br />
as the trainer monitor and have a large flat monitor attached to their lap top for the client.<br />
As noted above, the trainers monitor contains all the instruments that were not used to<br />
make the client’s screen on the second monitor. The client’s monitor only contains those<br />
instruments which you put there (or left there) and enlarged. You will note that all the<br />
inhibit items are labelled in red and the % over threshold for an inhibit instrument is also<br />
in red. Conversely all the enhance instruments and their associated %>threshold numbers<br />
are in green.<br />
The sound feedback has been attached to the animation. It is dependent on ALL the<br />
inhibits being below threshold and ALL the enhance variables being above threshold.<br />
When running a dual monitor system we usually make the variables (enhance and inhibit<br />
ovals, rectangles and bargraphs) on the trainer’s monitor very easy so that the emphasis is<br />
placed on the enhance and inhibit variables on the client’s monitor.<br />
You have the option of deleting all items you do not wish to have on the trainer’s screen<br />
and enlarge the few you want. However, if you do this, be sure to use ‘Save as…’ and<br />
give this new screen a new name! This is important so that you still have the original to<br />
make many other new screens.<br />
Copyright ADD Centres Ltd. Prepublication – 1 st draft. Please do not copy. Dr. Thompson 905-803-8066 Canada 110
THE ‘UNIVERSAL BASIC’ DISPLAY<br />
Left Monitor<br />
Right Monitor<br />
BOWLING SCREEN DERIVED FROM THE ‘UNIVERSAL DISPLAY’<br />
TRAINER’S SCREEN / CHILD’S SCREEN<br />
In the above screen the an adult client was using this children’s screen and he is<br />
attempting to find a mental state where 3-10 Hz is decreased (you would change this to a<br />
range more appropriate for your client based on your EEG assessment), 13-15 Hz SMR<br />
and 15-18 Hz problem solving beta, are raised. The ‘all points’ counter is at 3 meaning<br />
that on three occasions this client held all variables at their desired levels for more than 3<br />
seconds.<br />
Copyright ADD Centres Ltd. Prepublication – 1 st draft. Please do not copy. Dr. Thompson 905-803-8066 Canada 111
EXPLODING BALL ADULT SCREEN<br />
Adult Client who is Inattentive and Anxious<br />
TRAINER’S SCREEN / ADULT CLIENT’S SCREEN<br />
The client’s screen above has a 3-10 Hz rectangle and below it a 23-35 Hz rectangle.<br />
Below these is the single enhance variable. In this case it is SMR, 13-15 Hz. On the<br />
trainer’s monitor note the lack of synchrony between heart rate variability and<br />
respiration. Note too, that this client has high masseter muscle tension (where the active<br />
electrode had been placed) at 10.33. (He suffered from chronic pain in the left<br />
temporomandibular joint area. His muscle tension in past sessions had been at 13. You<br />
might also note that the (red background) ratio of 23-35/13-15 Hz is not too hig (1.27).<br />
(Most subjects are below 1.7) His theta/beta ratio (blue background) is at 2.37 which is<br />
above that which is seen in most adults. In the spectrum you can see the very high (red in<br />
the centre of the second spectrum) 8 Hz activity). If the EEG is enlarged and the time<br />
frame is changed from 30 seconds to 5 seconds then the raw EEG in the middle line<br />
graph on the left side could be examined for such things as beta spindling which may be<br />
seen in some very anxious clients.<br />
Copyright ADD Centres Ltd. Prepublication – 1 st draft. Please do not copy. Dr. Thompson 905-803-8066 Canada 112
BIOFEEDBACK + NEUROFEEDBACK SCREEN<br />
Client is Anxious and has ADHD<br />
TRAINER’S SCREEN / ADULT CLIENT’S SCREEN<br />
Note in the pair of monitors shown above, that this client is watching mainly biofeedback<br />
variables on the right hand monitor. However, EEG feedback is also being monitored on<br />
the right hand monitor using a 23-35 Hz rectangle (it is below threshold and therefore<br />
green) and a 13-15 Hz oval (it is below threshold and therefore red). The % > threshold<br />
for 23-35 Hz activity is 33 at this juncture. He is getting self-regulatory control of this<br />
variable. Note the lack of synchrony between heart rate variability and respiration in the<br />
two line graphs on the client’s monitor.<br />
Although this example screen has both EEG and biofeedback variables on the client<br />
screen you might decide for a particular client that you only wanted to have one or<br />
two variables visible for that client in any one session. You would then merely left click<br />
over the unwanted instruments and drag them over to the trainer’s screen. Then you<br />
might click on the instruments that are left and enlarge them on the client screen.<br />
Copyright ADD Centres Ltd. Prepublication – 1 st draft. Please do not copy. Dr. Thompson 905-803-8066 Canada 113
BASIC TRAINING SCREEN<br />
Being Made Using the Editor with The ‘Universal Display’<br />
TRAINER’S SCREEN<br />
CLIENT’S SCREEN<br />
This is a good training screen because it is very simple and the growth of the SMR oval<br />
should correspond to the shrinking of the 23-35 Hz rectangle. The client wants to achieve<br />
a mental state where both are being sustained in green.<br />
A very BASIC TRAINING SCREEN<br />
TRAINER’S SCREEN<br />
CLIENT’S SCREEN<br />
This type of screen is used to make and break the production of a specific band width. In<br />
the above example it is 23-35 Hz. This would usually be narrowed down to a specific<br />
range of say, beta spindling, for that client. The entire screen is BLACK when SMR goes<br />
below threshold.<br />
Copyright ADD Centres Ltd. Prepublication – 1 st draft. Please do not copy. Dr. Thompson 905-803-8066 Canada 114
xiii. Stress Assessment Display<br />
Choose PI MT EEG-Physio Initial Stress Assessment-Progress.prt. You can choose to<br />
Edit Script Settings if you wish to change the times for the stages.<br />
Goal<br />
To demonstrate to the client, how psychophysiological variables change depending on<br />
their mental state.<br />
Instrument<br />
STRESS ASSESSMENT SCREEN<br />
Frequency: 3 5 8 10 11 13 15 21 37, 42 62 Hz<br />
Procedure<br />
The physiological and biochemical changes with stress and the stress assessment purpose<br />
and procedure are described in the Neurofeedback Book. The Infiniti program allows us<br />
to use a ‘Script’ program to evaluate a client’s immediate reaction to stress and their<br />
ability to rapidly recover. The script program is quite helpful as it makes the procedure<br />
more consistent and somewhat easier for the client to understand. The initial screen states<br />
what the stages of the procedure will be and allows the therapist to expand on them and<br />
explain how they will be carried out. As noted above all the times for the steps can easily<br />
be changed by the trainer. The steps are:<br />
1. Baseline: This has a duration of one minute. The screen shown below appears at this<br />
time. Recording, however, does not start until the trainer hits any key on the keyboard.<br />
This allows the trainer time to explain, to the client, the meaning of the parameters that<br />
are being measured. It also allows the trainer time to make sure all the sensors are<br />
recording properly. For example, if EMG is ranging over 100 you know that that<br />
Copyright ADD Centres Ltd. Prepublication – 1 st draft. Please do not copy. Dr. Thompson 905-803-8066 Canada 115
sensor is too loose. For the initial stress assessment we often use the thought<br />
technology head band with EMG sensors on the frontalis muscles but sensors on other<br />
muscle groups such as the trapezius, sternocleidomastoid, occipitalis or masseter are<br />
excellent with most clients. If heart rate is fluctuating wildly you would also want to<br />
put the plethysmograph on more securely and help the client find a comfortable<br />
position for their hand so that they could hold it very still for the time periods required<br />
for recording. (Use the ‘stretchy’ medical tape for best results.) We normally put this<br />
sensor on either the thumb or the middle finger of the hand that does NOT have the<br />
temperature sensor. In this way the client can put the hand with the sensor that<br />
measures BVP on the desk or the arm of the chair if that is the most comfortable<br />
position for it. The temperature sensor must not be touching any other part of the body<br />
or a false warming of the sensor will occur. The respiration belt should be placed<br />
around the abdomen roughly at the level of the navel. It is placed over the clothing and<br />
the client can put it on and make sure it is tight enough to stretch when they take an<br />
abdominal (diaphragmatic) breath but not so tight that it is uncomfortable.<br />
The line graphs need some adjustment at this juncture. Click the arrow next to the<br />
‘seconds’ and highlight 30 seconds. Now make sure your client is comfortable and<br />
ask them if they would please sit perfectly still while you adjust the sensors. If they<br />
move their hand with the BVP sensor while you are trying to adjust things this will<br />
make it very difficult for you because the heart rate scale may suddenly vary from 4 to<br />
144 or more and this takes time to readjust. When they are perfectly still then right<br />
click each linegraph and check the auto-scale. This allows the scales to adjust to the<br />
proper ‘frame’ for this particular client. You can then do small adjustments on the<br />
scales for both the line graphs (click over the line graph and a red highlight line<br />
appears around it and then adjust using the max and min in the menu bar at the top of<br />
the screen). When you get lines appearing somewhat like those in the figure shown<br />
below then right click the instrument and stop the auto-scale to stop the automatic<br />
adjustment. Once you have stopped it your client can move their hand without the<br />
scales changing.<br />
2. Stroop Colour Test: This takes 2 minutes. This test shows the names of different<br />
colours: red, orange, green, purple, and yellow but these words are printed in some<br />
other colour than the name states. You instruct the client to tell you the colour the<br />
word is printed in (not what it says). When the list of words appears and disappears<br />
rapidly this becomes quite difficult and many people will have performance anxiety<br />
at this point. We tell the client that we are doing them ourselves as they do it.<br />
Note: New Stress Test option.<br />
The Stroop and math tests work well as stressors but there is one legitimate criticism<br />
to their use. These tests require the client to vocalize and this introduces both<br />
muscle artifact and breathing changes. We are therefore considering the<br />
introduction of another option for the stress test that may substitute very stressful<br />
noise for the Stroop test and a dice rotation exercise where the client chooses a<br />
number: one , two, or three, for the correct corresponding die that has been rotated.<br />
These stressors will not require vocalizing. Alternatively we could have the client<br />
check off correct answers on a sheet of paper.<br />
Copyright ADD Centres Ltd. Prepublication – 1 st draft. Please do not copy. Dr. Thompson 905-803-8066 Canada 116
3. Recovery: This is a 2 minute time period. You tell the client to just relax and think<br />
of something pleasant.<br />
4. Math: This is 2 minutes long. It is made very very stressful. I tell them that I will<br />
give them 2 numbers. They must add them and give me the answer. I will then give<br />
them another number which they must add to the LAST number that I SAID (not<br />
their answer). I tell the client that I will continue in this vein randomly saying<br />
numbers which they must add to the last number that I had said. I tell them that I<br />
am doing the math in my own head and seeing how quickly they are able to come<br />
up with the correct answer. By telling them this I am increasing their performance<br />
anxiety. When they get the wrong answer I ask them to keep trying or I repeat the<br />
two numbers to them (they then see that although they forgot the numbers I didn’t).<br />
I start them with the numbers 2, 3 and they say 5 then I say 7 and they should say<br />
10 and then I hit the key to start recording and I will say something like 17 and I<br />
will gradually make the numbers harder and harder (depending on the client we<br />
may end up in the hundreds). If you are not an expert at oral math, you can sit<br />
behind the client with your own crib sheet of standard numbers that get<br />
progressively more difficult and that you use with all clients.<br />
5. Recovery: This is another 2 minute time period. You tell the client to just relax and<br />
think of something pleasant.<br />
6. Relaxation: This is an opportunity to tell the client that they have done very well.<br />
Now both of you are going to relax for 3 minutes while doing abdominal breathing.<br />
You tell them that you will breathe noisily so that they can follow your breathing<br />
pattern which will be at a rate of 6 breaths per minute or one breath in each of the<br />
10 second frames on the screen (point this out to them). They should breathe<br />
quietly and comfortably. They should adjust the depth of their breathing so that<br />
they are breathing with me at a rate of 6 BrPM but their next breath should only be<br />
being taken because they “need” to breathe. You tell them that you will take a little<br />
longer on expiration than inspiration and will have a little rest at the end of each<br />
expiration. You would like them to let their shoulder muscles relax a little more<br />
each time they are breathing out. They want to feel really relaxed and warm. You<br />
then start breathing and when they are breathing with you hit the key to start the<br />
recording. Most clients will then observe heart rate variability in synchrony with<br />
their breathing as is shown below.<br />
Note that we have included a spectrum (1 second averaging) of the EEG in this<br />
display. Because all line graphs must have the same time frame in this program we<br />
did not put the raw EEG in because a 30 second raw EEG line graph is too long to<br />
be very helpful. However the spectrum gives you a good idea of how the power<br />
within different bandwidths of the EEG changes with stress and relaxation.<br />
At the end of the session you save the results, exit the program and renter the program<br />
by clicking Database, highlighting the client’s name in the left hand column and then<br />
Copyright ADD Centres Ltd. Prepublication – 1 st draft. Please do not copy. Dr. Thompson 905-803-8066 Canada 117
their stress session in the right hand column. Click Review/report and select the<br />
Stress Review screen.<br />
Change the time to 2 minutes, right click each instrument to turn o the auto-scale then<br />
click the forward arrow to move the linegraphs ahead a few seconds. The lines should all<br />
appear clearly on the graphs. Now change the time frame from 2 minutes to size to<br />
session and explain the findings to the client. This review screen puts all the variables as<br />
line graphs which makes it very easy for the client to visualize the changes with stress<br />
and the degree to which they were able to recover.<br />
xiv. Stress Assessemnt Review Screen<br />
Base Stroop Recovery Math Recovery Breathing Together<br />
The above client was unusual in that she had done Yoga and practiced breathing for a<br />
number of years in these classes. Her breathing recovery was therefore rapid.<br />
However, she still had performance anxiety. She felt very stressed doing math and<br />
her skin temperature and muscle tension did not recover as well as her breathing<br />
after this stress.<br />
In screen editor, you can change the background colour, and the line colours. If you<br />
make the background white then use a print-screen (PrtSc key) and putting this<br />
summary of your stress assessment in Word or in Excel you may find it easier to<br />
print and you may prefer it to the automatic one that is made when you click the<br />
‘printer’ icon and ‘print’ statistics and graphs to Word for Windows.<br />
Copyright ADD Centres Ltd. Prepublication – 1 st draft. Please do not copy. Dr. Thompson 905-803-8066 Canada 118
Base Stroop Recovery Math Recovery Breathing Together<br />
In this example you would artifact out any large excursions of the line that were just<br />
responses to movement or any other type of artifact. Artifacting this is virtually the same<br />
as artifacting an EEG. This man demonstrated a very large rise in skin conduction (EDR)<br />
and a drop in skin temperature with the Stroop test. He had real performance anxiety at<br />
the beginning of the session and he looked worried with tense muscles. He recovered<br />
well in breathing, heart rate, muscle tension, skin temperature and EDR after the Stroop<br />
and again after the math test but he felt quite anxious when I asked him to breath with<br />
me at 6 breaths per minute.<br />
Copyright ADD Centres Ltd. Prepublication – 1 st draft. Please do not copy. Dr. Thompson 905-803-8066 Canada 119
Base Stroop Recovery Math Recovery Breathing Together<br />
This young woman felt under very real stress with the Stroop colour test. Her heart rate<br />
muscle tension and EDR all rose while her skin temperature fell. She did not recover in<br />
the 2 minutes following although her skin temperature stopped falling. Her respiration<br />
remained shallow, irregular and rapid. With math she again felt under stress. However,<br />
after the math she knew there were no more performance tests and her finger temperature<br />
shot upwards. She felt a little performance anxiety as she copied the examiners breathing<br />
(note skin temperature) but was pleased to see the synchrony of heart rate variability with<br />
her breathing. She appropriately decided that she would like to have heart rate variability<br />
and respiration line graphs and a skin temperature monitor on her feedback screens.<br />
Copyright ADD Centres Ltd. Prepublication – 1 st draft. Please do not copy. Dr. Thompson 905-803-8066 Canada 120
PART 6: 2 Channel Training<br />
XV. Coherence<br />
Unlike comodulation, there has been a great deal of work done using coherence.<br />
Intrahemispheric coherence abnormalities are well published and this may prove to be a<br />
valuable area for 2 channel feedback. Neuroguide (Dr Robert Thatcher) is one of the full<br />
cap analysis programs that gives good documentation on coherence.<br />
To do coherence training you should have a full cap (19 or more channel) assessment<br />
done and analysed against an accepted data base. In the above figure Neuroguide (Robert<br />
Thatcher) has been used. This client is improving rapidly decreasing coherence in alpha<br />
and beta between T3 and P4.<br />
In the Infiniti the coherence feedback screens are in their own channel set:<br />
PI MT 2EEG-Coherence FB.chs<br />
The learning disabled client may show, for example, hyper-coherence between various<br />
sites that are related to the disability.<br />
As an example, one of our University students was struggling with his courses. He was<br />
hyper-coherent between P4 and T3 in alpha (8-12 Hz). This decreased if he did exercises<br />
where he had to visualize in order to memorize details and then to later recall detailed<br />
information concerning pictures. He used the two screens shown below.<br />
Copyright ADD Centres Ltd. Prepublication – 1 st draft. Please do not copy. Dr. Thompson 905-803-8066 Canada 121
For Assessment:<br />
For Specific Feedback our client used the following screen:<br />
Copyright ADD Centres Ltd. Prepublication – 1 st draft. Please do not copy. Dr. Thompson 905-803-8066 Canada 122
The full cap assessment shows clearly, for coherence, the frequency and sites and tells<br />
you Z scores. Using this information you know if your client is 2 standard deviations<br />
above or below the data-base mean. The absolute value of the raw number, shown in the<br />
screen above for coherence, is not the important issue. Your client’s objective is to raise<br />
(if they were hypo-coherent) or, as in our client’s case, lower (he was hyper-coherent<br />
between T3 and P4) the value seen on the Infiniti screen. The coherence score on the<br />
screen shown above happened to be high in this case but it could have been lower. For<br />
example, another client, who had to lower the coherence between two sites, had a starting<br />
value on the above screen of 32.<br />
We hit ‘PrtSc’ (upper right of computer key board) and pasted the picture of this screen<br />
into Excel. Then we right-clicked and chose ‘format’ and took the entire top of the screen<br />
off so only the histogram of his progress was left in our record for this 400 seconds of<br />
recording. We only do this after really good examples of his gaining complete control of<br />
the coherence amplitudes and he then writes below the ‘picture’ what he was doing that<br />
made the difference. For this University student, it absolutely correlated with the mental<br />
work that he was doing.<br />
Summary Screen<br />
You can also paste this picture into your excel report file. Our clients have squared graph<br />
paper in front of them and they write down the mean score for whichever frequency they<br />
are working on at the end of each 20 second segment.<br />
Z score training has been suggested and Thought Tech usually responds rapidly to<br />
suggestions so we can probably expect this in the near future.<br />
Copyright ADD Centres Ltd. Prepublication – 1 st draft. Please do not copy. Dr. Thompson 905-803-8066 Canada 123
2 Channel Training<br />
Important Note: In the following the descriptions are only just descriptions that are<br />
given to introduce the reader to a small number of possible 2 channel screens. The actual<br />
placement of the electrodes and the bandwidths to enhance and inhibit are entirely based<br />
on the EEG assessment findings. NONE of the following are intended as protocols<br />
because you will individualize placements and bandwidths for each client according to<br />
your findings on assessment, your knowledge of neuroanatomy/functional significance of<br />
areas of the cortex, and the symptom picture (see decision making triangle in The<br />
Neurofeedback Book, www.AAPB.org).<br />
The ‘T’ set of display screens are used for two-channel training. These screens are<br />
confusing for some clients because they find that there is just too much information.<br />
Other clients find them easy to use and very helpful. They are always used with very<br />
specific purposes in mind. Under coherence (or comodulation) training the use of 2 (or<br />
more) channels is essential and was described above.<br />
All of the following screens have a vertical mind-mirror display to allow comparison of<br />
the spectral activity of the two active electrode sites. The one exception is one of the<br />
assessment screens where the mind-mirror is horizontal between the two EEGs.<br />
Copyright ADD Centres Ltd. Prepublication – 1 st draft. Please do not copy. Dr. Thompson 905-803-8066 Canada 124
xvi. Assessment Screens:<br />
T-AA is the assessment screen. It shows D EEG 2-40 Hz, the one second average<br />
spectrum for this channel and the E EEG 2-40 Hz channel with its spectrum. However a<br />
second assessment screen T-AA mind-mirror, is perhaps more useful. It shows the<br />
spectrums in the form of a horizontal mind-mirror placed between the two EEGs. These<br />
screens allow the trainer to artifact and run statistics for both channels. Two channel<br />
assessments can be very helpful when a centre does not have the capacity to do a full-cap.<br />
To do a quick assessment of a number of different sites the trainer should begin by<br />
cleaning all the sites that are to be used and putting on each a mound of 10-20 conductive<br />
paste. You should always use a common reference and ground. To do this use a linkedears<br />
electrode to both channels D and E and a common ground (often placed in the centre<br />
of the occipital area (less eye blink artifact) and attached to both channels D and E.<br />
(These electrodes are specially made for Dr. Vietta Sue Wilson and the author by IMA<br />
electronics in Florida).<br />
You may decide to compare F3 & F4, P3 & P4, Fz & Cz, Cz & Pz and perhaps also C3 &<br />
C4. Which pairs you decide to use will depend on the client’s symptoms. In dysphoria,<br />
for example , you would use F3 & F4 whereas in Asperger’s you might well try P3 & P4<br />
and even F3 & P4 which we didn’t list above. In dyslexia you might also do P3 & P4. As<br />
you can see, doing more than one or two pairs can get quite time consuming and still not<br />
give nearly the accuracy or the comprehensiveness of information that you can get in the<br />
same or less time using a full-cap. Having said this, it is often not economically possible<br />
for a client to have a full-cap and we believe that one should follow the principle of<br />
Copyright ADD Centres Ltd. Prepublication – 1 st draft. Please do not copy. Dr. Thompson 905-803-8066 Canada 125
parsimony. This principle states that you consider doing the least invasive, least<br />
disruptive, least expensive and time-consuming intervention first. For ADHD in children<br />
you can almost always obtain sufficient information from a single channel EEG<br />
assessment at Cz. This information will, in most circumstances, allow you to carry out a<br />
responsible, successful, intervention, without resorting to a 19 channel full-cap. This has<br />
the positive effect of enabling families who are not well off to spend less of their money<br />
on assessment and more on doing something about the problem. With a head injury or a<br />
learning disability, on the other hand, even multiple two-channel assessments are often<br />
not sufficient and a full cap should be done as the initial EEG.<br />
(For 19 channel assessment one relatively low cost yet thorough option that contains a<br />
large data base with a great many children is Mindset + Neuroguide - available through<br />
Robert Thatcher, Hwww.appliedneuroscience.com .)<br />
Whatever method is used, pre-training and post-training assessments done under the same<br />
conditions are very useful in assuring that you are encouraging a lasting neurological<br />
shift in a positive direction.<br />
A Caution: Common reference and common ground electrodes are essential for 2<br />
channel assessments and training for without them you could have different impedances<br />
for the 2 channels for the ground and reference electrodes. Different impedances will<br />
effect the quantitative values you obtain and could make it look on assessment, for<br />
example, as though you had a difference in magnitude of a wave-band between the two<br />
hemispheres when in fact there was none. You must have virtually the same impedances<br />
in all the active electrode sites for accurate comparisons. HOWEVER, even with all these<br />
precautions you still cannot accurately compare sets of sites because they are done at<br />
different times and mental states change rapidly.<br />
xvii. 2 Channel Feedback Training Display Screens<br />
Important Note #1: As a general rule, when we are training right and left brain activity,<br />
we use the ‘C’ channel for the left brain and the ‘D’ channel for the right brain.<br />
When we are training intrahemispheric, anterior vs posterior, we use channel C for<br />
posterior and channel D for anterior (in keeping with neuroguide statistics).<br />
Important Note #2: Screens must be individualized – adjusted to fit the needs of a<br />
particular client. For example, electrode placement and frequency bands will have to be<br />
individually set for each client. The animation may be changed or hidden or placed on to<br />
a second monitor according to the age and need of the client. Sound feedback should fit<br />
the client’s need.<br />
Note #2: ‘A’ refers to screens which increase 13-15 Hz (SMR) and ‘B’ to screens that<br />
increase 15-18 Hz (problem-solving beta).<br />
Important Note #3: We do not use asymmetry scores to dictate that we should just<br />
“change the asymmetry”. Asymmetry is only a ‘signal’ that will most often mean that<br />
one or other site is either too high or too low in amplitude. Your job is to find out which<br />
Copyright ADD Centres Ltd. Prepublication – 1 st draft. Please do not copy. Dr. Thompson 905-803-8066 Canada 126
site is abnormal and correct that site. If you were to merely reward changing asymmetry<br />
you might be moving the normal site in the wrong direction.<br />
Two Channel Training - Screen Ideas<br />
(In the new MT screens only a few basic screens are given. The items listed below are<br />
suggestions for you to make by adjusting the bargraphs other instruments on any of the<br />
dual-monitor screens we have given in the program.)<br />
By this time you have become somewhat adept at moving things around on complex two<br />
monitor screens in order to make a screen that fits the needs of a particular client.<br />
The following are therefore just a few ideas for screens. You can move instruments<br />
around using screen editor to make any of these. We have made a few starting screens<br />
for you and some of these are shown in figures below.<br />
T-B1A1 DyslexiaFocus&Calm Dart is a 2 channel screen. It could be used in the<br />
dyslexic ADHD child, for example, to activate the left temporal-parietal region around<br />
Wernicke’s area for dyslexia with channel C while increasing SMR and decreasing the<br />
dominant slow wave activity at C2 or C4 to improve the symptoms of ADHD with<br />
channel D. (Note, at the center you could decide to use a single channel and focus at the<br />
beginning and end of the session on SMR at Cz or C4 and ‘pair’ reading and listening<br />
tasks with activation at Wernicke’s area.) The screen below could have any animation<br />
and it is very simple. The child only is trying to increase points for holding all variables<br />
at the correct level. You choose which variables are important. You change the<br />
frequency ranges according to the child’s assessment. You make the variables that are not<br />
important this training session easy by placing the thresholds at levels that keep the<br />
bargraph green. In this way the only variables that are critical for the points and the<br />
animation and music are the ones you have chosen to make somewhat difficult.<br />
Trainer’s Monitor<br />
Child’s Monitor<br />
T-B2A2 AprosodiaAnxiety is a 2 channel screen used to activate 2 different areas. For<br />
example, in Asperger’s there is inactivation (corresponding to a sensory aprosodia) in the<br />
right temporal-parietal region and there may be marked anxiety with low SMR in the<br />
CzFz (or C4) region. When using an electrode at CzFz we will be reducing beta spindling<br />
(when present) in the high frequency beta spectrum. <strong>Bio</strong>feedback is also used to assist in<br />
the reduction of anxiety therefore respiration, EMG, and skin temperature are also on this<br />
screen. They can be hidden when not in use. (This is the “activate the right side” screen)<br />
Copyright ADD Centres Ltd. Prepublication – 1 st draft. Please do not copy. Dr. Thompson 905-803-8066 Canada 127
T-B1 AprosodiaInattention is a 2 channel screen used to activate 2 different areas. In<br />
Asperger’s there may be inactivation with high amplitude slow wave activity<br />
(corresponding to a sensory aprosodia) in the right temporal-parietal region while in the<br />
central cortex or in the left frontal area there may be slowing with symptoms of<br />
inattention.<br />
T-B2 DyslexiaAprosodia is a 2 channel screen used to activate 2 different areas.<br />
Although left brain verbal functions are usually very advanced in clients with Asperger’s<br />
we do see client’s who have both Dyslexia and Asperger’s. High amplitude slow wave<br />
activity is noted at P3 (and somewhat at C3) on the left (corresponding to difficulties with<br />
comprehension) and at P4 (and T6) on the right (corresponding to a sensory aprosodia).<br />
Important Note: Screens must be individualized – adjusted to fit the needs of a<br />
particular client. For example, electrode placement and frequency bands will have to be<br />
individually set for each client. The animation may be changed or hidden or placed on to<br />
a second monitor according to the age and need of the client.<br />
T-B3 DepressionBalance&Activation refers to a 2 channel screen used to change the<br />
balance of activity in two areas of the cortex. For example, in dysphoria (mild to<br />
moderate depression) the trainer may wish to activate the left frontal lobe relative to the<br />
right frontal lobe. In this example the Channel D EEG would be used to encourage<br />
activation in the left frontal cortex by increasing beta at F3 while decreasing the ratio of<br />
dominant slow wave between the two hemispheres at F3 and F4 respectively. In this<br />
example, the ratio is C3-10 Hz / D3-10 Hz where the client is to decrease the ratio.<br />
However, although 3-10 Hz is used on the screen this should be individualized for each<br />
client.<br />
This client’s first session. Breathing is in synchrony with heart rate. Skin temperature is<br />
low. Note the EMG. This high number should alert you to the fact that something is<br />
wrong with the attachment. Usually it means that it is too loose or that hair is beneath the<br />
electrode. Theta is high on the right compared to the left and beta is low on the right<br />
compared to the left. This is what one would like to see. It should correspond to more<br />
activation on the left which usually correlates with a good mood. The opposite finding<br />
may correspond to dysphoria and depression. The numbers below the bargraphs in the<br />
client’s monitor show % time >C where C is the constant 1 (If always at 1 it would mean<br />
equal time above and below threshold, i.e., they are the same). In the above example theta<br />
is 99 % of the time greater on the right than the left (left frontal lobe is more active than<br />
the right). Beta is only 38% of the time greater on the right than the left meaning the left<br />
Copyright ADD Centres Ltd. Prepublication – 1 st draft. Please do not copy. Dr. Thompson 905-803-8066 Canada 128
lobe has more beta and is more active. For some trainers this type of screen makes more<br />
logical sense than the traditional A-B/A+B. Use which ever screen makes sense to you.<br />
When working with depression the principle is the same, you want the left frontal lobe to<br />
show more activity than the right.<br />
In this screen the % >C is greater under the left frontal (F3) 3-10 Hz bargraph than it is<br />
on the right. The left frontal thalpha needs to be deceased. The screen below allows the<br />
client to train heart rate variability and muscle tension and left frontal thalpha relative to<br />
right frontal thalpha all at the same time.<br />
T-B4 ActivationBrainBrightening is a 2 channel screen used to activate 2 different<br />
areas. In dysphoria (depression) with lack of ‘drive’ one might consider ‘activation’ at Pz<br />
by increasing high alpha (11-12 Hz) and activation of the left frontal cortex by decreasing<br />
the dominant slow wave (less than 10 Hz) activity, decreasing any beta spindling activity<br />
if seen in the assessment, and increasing low beta (in the range of 13-18 Hz).<br />
T-E1 CalmMoodElevation is a screen where channel C may be placed at F3 and used to<br />
decrease the dominant slow wave and increase activity in the dysphoric client. Channel C<br />
may be placed between F4 and C4 and used to increase SMR (perhaps also 11-12 Hz)<br />
and decrease beta spindling in the client who has dysphoria combined with anxiety (and<br />
even panic). Again, the specific placements and bandwidths used are dependent on the<br />
findings during assessment and the forgoing is only meant to give an example based on a<br />
number of clients who trained at our centre. This is combined with biofeedback which<br />
usually includes respiration, EMG, EDR, and skin temperature. In the screen below the<br />
Copyright ADD Centres Ltd. Prepublication – 1 st draft. Please do not copy. Dr. Thompson 905-803-8066 Canada 129
Triplane moves around the islands when all the variables are going in the correct<br />
direction. The client works on heart rate variability at the same time.<br />
T-E2 CalmMoodElevationOpenAwareness is a 2 channel screen that may be used to<br />
decrease non-productive beta activity (often in the range: 19-35 Hz) while increasing<br />
broad open awareness and calm concentration. For example, in Asperger’s, the trainer<br />
may wish to activate the right temporal-parietal region and to decrease the beta-spindling<br />
in the central-frontal region (depends where it is seen in the assessment). Channel D EEG<br />
decreases the dominant slow wave, decreases 23-35 Hz (or the specific bandwidth for<br />
spindling) and increases 13-16 Hz in the frontal cortex, while Channel E would either<br />
increase SMR in the C4-F4 region or increase 11-13 Hz, high-alpha at PZ or CzPz. This<br />
is combined with biofeedback which usually includes respiration, EMG, EDR, and skin<br />
temperature.<br />
T-E3 CalmOpenAwareness is a 2 channel screen that may be used to decrease nonproductive<br />
beta activity while increasing broad open awareness and calm concentration.<br />
For example, in the dysphoric, overanxious, ruminating adult channel D may be used to<br />
increase 11-12 Hz at Cz-Pz where appropriate and channel E to decrease beta spindling<br />
and increase SMR in the left frontal-central cortex. In the autistic child the activation may<br />
be at Pz. decreasing the dominant slow wave activity and increasing 11-12 Hz.<br />
NOTE: At our center these objectives are often best met using a Universal single channel<br />
screen. It has a “scenes of Venice” Client monitor with Rumination/SMR on the left side<br />
and Intensity/11-12 Hz on the right. The electrode placement is often FzCz. Respiration<br />
is along the base of the screen.<br />
T- UNIVERSAL is a 2 channel universal screen that we will be adding at a later date.<br />
Its purpose is to allow you to make more 2 channel screens that will meet the needs of a<br />
specific client or group of clients. It includes all the biofeedback variables. It has a one<br />
line spectrum for D EEG and E EEG respectively and a mind-mirror vertical spectral<br />
display. For each of the two EEG channels it has one slow wave and one fast wave (high<br />
beta) rectangle for inhibits. It has 2 enhance ovals for SMR 13-15 Hz and for problem<br />
solving beta 15-18 Hz. However it only requires a single 52-58 H inhibit bargraph which<br />
is arbitrarily placed on channel D. Again the animation and the ‘All Points’ counter are<br />
based on meeting all criteria on both EEG channels. Corresponding Ratios are also<br />
included for different bandwidths for each channel such as: D:3-10Hz/E:3-10Hz, D:15-<br />
Copyright ADD Centres Ltd. Prepublication – 1 st draft. Please do not copy. Dr. Thompson 905-803-8066 Canada 130
18Hz/E:15-18Hz. Other two channel ratios such as: D:23-35Hz/E:13-15Hz, D:3-<br />
10Hz/E:15-18Hz are included.<br />
These ratios can be changed. But this is not advisable. To do so one must enter the<br />
channel set and change the original meaning of the band-widths that are used in the ratio<br />
you are altering by changing the upper and lower frequencies. Since you cannot change<br />
the names for these bandwidths within the channel set you must write down what you<br />
have done so that you can change them back again later or so that you can put labels over<br />
them in edit that will accurately describe the new ratio frequencies. The only exception to<br />
this are those few people who have the channel editor software and they can make an<br />
entirely new channel set.<br />
Copyright ADD Centres Ltd. Prepublication – 1 st draft. Please do not copy. Dr. Thompson 905-803-8066 Canada 131
Part 7: Appendix<br />
1. To move client files from one computer to another<br />
1. In the infiniti program select the database option from the top menu line.<br />
2. Click the files you want to move (hold down control and click each name to<br />
highlight it.)<br />
3. Click export and it will ask if you wish to export these files. When you say yes it<br />
will give a screen that will allow you to choose the destination (e.g., your memory<br />
stick) to which you wish to send the files.<br />
4. Then you reverse the process in the second computer. You enter the infinity<br />
program, click database.<br />
Click Import Clients and then you browse to find the drive from which you wish to<br />
import your clients. In our example it is our memory stick.<br />
The following screen, shown below, will appear. PLEASE NOTE: When this screen<br />
appears DO NOT SELECT ANY CLIENT ID, just click OK. (This screen is just<br />
confirming that you have selected the correct drive.)<br />
The program will find the appropriate files and a client database screen will appear.<br />
Select one or more client(s) that you wish to import and then click OK.<br />
Copyright ADD Centres Ltd. Prepublication – 1 st draft. Please do not copy. Dr. Thompson 905-803-8066 Canada 132
These clients will then be correctly imported to this computer’s client database file.<br />
ii. Recording Client Statistics During the Session<br />
At the <strong>Bio</strong>feedback Institute we prefer to use ‘Excel’ as was described on<br />
page 24 in the “First Day” section of this guide.<br />
However,<br />
If You Wish to Save In Word Instead of Excel:<br />
The Infiniti program allows you to click print when you stop recording and the statistics<br />
pop up on the screen. When you click print the statistics that you have chosen for that<br />
session are in a table format in Word for Windows. Reformat this table so that it appears<br />
like the table in the illustration shown below.<br />
To do this, place your mouse over the left line of the thin column with the statistics<br />
numbers and draw that line over to the edge of the bandwidth names. Repeat this<br />
process with the right edge line on the right hand side of the statistics and draw it over<br />
to the left to the edge of the numbers. With your cursor in the right hand statistics<br />
column, click table, then insert and columns to the right. A new column appears on<br />
the right hand side of the table.<br />
Click file and save as and enter the client’s name. The folder is now saved in the Temp<br />
folder in the Program Files, Thought Technology, Infiniti, files. You now exit and run the<br />
next session. At the end of that session (usually 3 to 5 minutes), when statistics pop up,<br />
click print and highlight just the column of figures in the table that has appeared in Word<br />
for Windows. Click Edit and copy these numbers. Now open the file you just made for<br />
your client (File – then it is the first or second name on the list) and paste these numbers<br />
into the blank column you had made on the right hand side of the statistics list from your<br />
first session. Continue in the same manner for your next few sessions and you will have,<br />
at the end of that days training, a sheet of statistics like the one shown below. You can<br />
Copyright ADD Centres Ltd. Prepublication – 1 st draft. Please do not copy. Dr. Thompson 905-803-8066 Canada 133
type your notes about the session and print these statistics and notes for your hard-copy<br />
client file.<br />
1 2 3 4 5 6<br />
Description Value Value Value Value Value<br />
C: Delta-Theta Mean (µV) 6.53 8.80 8.06 8.11 8.08<br />
C: Theta Mean (µV) 5.94 7.48 7.08 7.19 7.03<br />
C: 3-10Hz Mean (µV) 8.00 10.42 9.74 9.47 9.70<br />
C: Thalpha Mean (µV) 5.59 6.52 6.46 6.19 6.45<br />
C: Low Alpha Mean (µV) 3.98 4.59 4.64 4.24 4.45<br />
C: High Alpha Mean (µV) 2.11 2.74 2.93 2.80 2.93<br />
C: 12-15Hz Mean (µV) 3.65 3.94 4.41 3.96 4.26<br />
C: SMR Mean (µV) 2.89 3.18 3.50 3.12 3.33<br />
C: 13-16Hz Mean (µV) 3.44 3.73 4.16 3.70 4.01<br />
C: Problem-solving Mean (µV) 3.13 3.47 3.84 3.40 3.89<br />
C: Beta Mean (µV) 3.44 3.81 4.41 3.68 4.39<br />
C: Wide Beta Mean (µV) 5.10 5.54 6.40 5.41 6.34<br />
C: Intensity Mean (µV) 2.67 2.96 3.71 2.80 3.66<br />
C: 23-27Hz Mean (µV) 2.28 2.66 3.38 2.50 3.73<br />
C: Busy-brain Mean (µV) 3.67 4.28 5.70 3.93 6.31<br />
C: 28-32Hz Mean (µV) 2.00 2.42 3.24 2.14 3.57<br />
C: Sheer Mean (µV) 1.57 2.01 2.81 1.85 3.17<br />
C: EMG noise Mean (µV) 1.95 2.06 2.65 1.86 2.85<br />
C: Theta sq/Wide Beta sq Mean 4.89 9.46 4.42 6.74 4.27<br />
C:Delta-Theta/12-15Hz Mean(µV) 2.43 3.06 2.51 2.92 2.64<br />
C: Delta-Theta/SMR Mean 3.18 3.78 3.28 3.83 3.47<br />
C: Theta/Beta Mean 2.49 2.65 2.19 2.77 2.26<br />
C: Thalpha/Beta Mean 2.31 2.35 1.98 2.35 2.06<br />
C: Low Alpha/5-7Hz Mean 1.28 1.20 1.25 1.08 1.20<br />
C: 12-15Hz/Prob-solving Mean 1.58 1.53 1.55 1.59 1.46<br />
C: SMR/Probl-solving Mean 1.24 1.29 1.28 1.32 1.18<br />
C: Intensity/High Alpha Mean 2.23 1.68 1.92 1.49 2.05<br />
C: Busy-brain/12-15Hz Mean 1.57 1.67 1.91 1.50 2.29<br />
C: Busy-brain/SMR Mean 2.39 2.11 2.53 1.98 3.14<br />
E: SC Mean (µMhos) 2.21 2.64 2.75 3.19 3.22<br />
F: Temp Mean (degrees) 93.35 93.33 94.31 94.66 92.46<br />
G: BVP HR Mean (beats/min) 52.47 55.51 55.88 55.37 55.35<br />
H:Resp Rate Mean (br/min) 18.80 9.04 6.16 11.46 5.31<br />
Column 1 above, shows the first 40 seconds. This adult client was very attentive and did<br />
not blink. Columns 2 to 5 are for 7 minutes each. We did not record statistics for two 5<br />
minute runs between #s 2 and 4 above. The statistics are not artifacted. However the<br />
second and 4 th sessions have little artifact and our client felt they best represented his<br />
beging and ending states. He therefore wanted to use them for comparison purposes.<br />
Comparing column 2 with column 4 all theta and low alpha bands improved (decreased)<br />
while high alpha increased. The picawatt ratio (Theta sq/Wide Beta sq Mean) decreased<br />
Copyright ADD Centres Ltd. Prepublication – 1 st draft. Please do not copy. Dr. Thompson 905-803-8066 Canada 134
and BusyBrain/SMR decreased. He was most attentive during the 4 th series. He was<br />
more relaxed (skin temperature rose) and alert (EDR rose). However he was not<br />
breathing at 6 BPM. During the final time period, column 5, he was attempting to breathe<br />
at a slow and regular rate but in doing so he became more anxious and his skin<br />
temperature dropped and skin conduction and jaw muscle tension (not shown) rose. He<br />
worried about how he was doing and this is reflected in the increase in Busy-brain/SMR<br />
ratio (though muscle tension also affected this).<br />
This process may also make it easier to do the suggested graphs shown below.<br />
Note: This is just a ‘concept’ Our staff have already gone ahead with their own version.<br />
Copyright ADD Centres Ltd. Prepublication – 1 st draft. Please do not copy. Dr. Thompson 905-803-8066 Canada 135
Child<br />
age:<br />
ADD CENTRE<br />
µv Graph of Enhance and Inhibit Frequencies<br />
DATE:____________________<br />
Client name:_____________________________Session #_________________EEG instrument__________<br />
Trainer name:____________________________Site(s)____________________Time of day______________<br />
Please modify the scale on the graph to make changes appear larger and easier to see.<br />
RATIO Inhibit Enhance<br />
7 28 10<br />
6 26 9<br />
5 24 8<br />
4 22 7<br />
3 20 6<br />
2 18 5<br />
1 16 4<br />
0 14 3<br />
Time(min)<br />
Activity<br />
Please indicate frequency ranges in the brackets below<br />
Add your own colour code for graphing ratios and beta<br />
THETA-red ( Hz )<br />
SMR-green ( Hz )<br />
Ratio 1( / Hz)<br />
EMG<br />
BETA ( Hz )<br />
Ratio 2( / Hz)<br />
Thresholds: Theta_________ SMR_____________Beta_______EMG________<br />
SESSION NOTES<br />
TOTAL NFB (min):__________<br />
Metacognitive Strategies reviewed<br />
Recommendations Copyright for next ADD session Centres Ltd. Prepublication – 1 st draft. Please do not copy. Dr. Thompson 905-803-8066 Canada 136
Adult<br />
ADD CENTRE<br />
µv Graph of Enhance and Inhibit Frequencies<br />
DATE:<br />
Client name:___________________________Session #____________________<br />
Trainer name:_________________________ Site(s)_______________________<br />
EEG instrument__________<br />
Time of day______________<br />
Please modify the scale on the graph to make changes appear larger and easier to see.<br />
RATIO Inhibit Enhance<br />
4.5 20 8<br />
4 18 7<br />
3.5 16 6<br />
3 14 5<br />
2.5 12 4<br />
2 10 3<br />
1.5 8 2<br />
1 6 1<br />
Time(min)<br />
Activity<br />
Please indicate frequency ranges in the brackets below<br />
Add your own colour code for graphing ratios and beta<br />
THETA-red ( Hz )<br />
SMR-green ( Hz )<br />
Hi Beta ( Hz )<br />
BETA ( Hz )<br />
EMG<br />
Ratio 1( / Hz)<br />
Ratio 2( / Hz)<br />
Thresholds: Theta_________ SMR__________ HiBeta________Beta_______EMG________<br />
SESSION NOTES<br />
TOTAL NFB (min):__________<br />
Metacognitive Strategies reviewed<br />
Recommendations for next session<br />
Copyright ADD Centres Ltd. Prepublication – 1 st draft. Please do not copy. Dr. Thompson 905-803-8066 Canada 137
Note: The following graph must be copied separately to another document and then<br />
printed as a “landscape”.<br />
ADD CENTRE<br />
Graph of Microvolt levels of Enhance & Inhibit Frequencies in Sessions 1-40<br />
INHIBIT<br />
Name:_______________<br />
ENHANCE<br />
4.5 32<br />
30<br />
4<br />
28<br />
26<br />
24<br />
3.5 22<br />
20<br />
3<br />
18<br />
16<br />
14<br />
2.5 12<br />
10<br />
2<br />
8<br />
Sess<br />
#<br />
1 2 3 4 5 6 7 8 9 10 11 12 13 14 15 16 17 18 19 20 21 22 23 24 25 26 27 28 29 30 31<br />
_____Hz = RED, ____Hz = ORANGE, _____Hz = GREEN, _____Hz = BLUE,<br />
RATIO _____/_____ = BLACK,<br />
Best Score = Solid line, Average Score without worst period = Dotted line<br />
iv. Comodulation (Spectral Correlation)<br />
The new Infiniti program allows you to do coherence (later it may include comodulation<br />
training). There are usually clear cut findings in the assessment of persons who have had<br />
a head injury. These assessments (as is shown below) often show a definite lack of<br />
comodulation between the right and left frontal lobes (often interpreted as a ‘disconnect’<br />
and a lack of communication between areas of the cortex). With these findings, training<br />
would comprise increasing the comodulation between F3 and F4 (spectral correlation of<br />
the individuals dominant frequency in the two areas over time).<br />
Copyright ADD Centres Ltd. Prepublication – 1 st draft. Please do not copy. Dr. Thompson 905-803-8066 Canada 138
The assessment shown below was carried out using the Neuronavigator instrument (19<br />
lead assessment) and analysed using the SKIL program. In this assessment you will note<br />
that there is also a rather complete lack of comodulation between C3 and other cortical<br />
areas (isolation of C3). The Infiniti program allows you to use 2 channels (usually<br />
channels C and D) of EEG with a common reference (linked ears) and a common ground<br />
to do coherence training because you will usually find that coherence is decreased when<br />
this type of disconnect is seen with SKIL. The case example shown below is given<br />
because this teenager was referred due to ADHD symptoms affecting his school work but<br />
when the history was taken it was discovered that he had had a rather serious head injury<br />
six months previously. With ADHD the single lead assessment is usually sufficient and it<br />
gives a clear indication of slow wave activity at Cz. (This is also seen in the 19 lead<br />
SKIL assessment as is shown in Figures 9 and 7 below.)<br />
However, with a head injury we always advise that a 19 lead ‘full-cap’ assessment be<br />
done. This teenager had been kicked in the left fronto-temporal region during a Tai-<br />
Kwon-do sparring match 6 months before this EEG was done. He is at the top of the<br />
National levels in this sport. He continued sparring for a few minutes after the blow to his<br />
head. However, about 10 minutes after the blow he began to vomit. In reviewing the<br />
incident with him he revealed that after the injury he had developed problems with<br />
balance and had seen an ENT specialist who felt that his symptoms were indicative of a<br />
post-concussion syndrome. He suffered from vertigo, headaches (diagnosed as ocularmigraine)<br />
and nausea for several weeks after this kick to his head. Academically he has<br />
difficulty organizing his work. His best subject is math while English and French are his<br />
weak subjects. He has a history of difficulty maintaining attention in class. These<br />
attention difficulties predated the blow to the head. The full-cap comodulation analysis<br />
(figure 10 below) showed what are considered to be clear indicators of head injury.<br />
The light grey lines are 2 standard deviations above and below the data base norms. The<br />
heavy black line is the mean for the data base. Central theta above the norm for the data<br />
base is what one would expect in ADHD.<br />
Copyright ADD Centres Ltd. Prepublication – 1 st draft. Please do not copy. Dr. Thompson 905-803-8066 Canada 139
The above EEG was done when This boy was doing a math task. Although the slow<br />
activity, 3-6 Hz, may be in part due to artifact, its central and frontal location during a<br />
math task correspond well to what is usually found in ADHD. The alpha activity at C3<br />
and C4 could be due to ‘mu’ but when the EEG was examined carefully the wave form<br />
was that of alpha and not the wicket rhythm seen with mu.<br />
Figure 10.<br />
Dark blue is two standard deviations below the mean for this data base while red is two<br />
standard deviations above the mean.<br />
For example, in the above brain map the F3 site communicates normally with itself (light<br />
green) and it does not communicate with F4 (dark blue). In this brain map, left-right<br />
dissociation is seen with eyes closed at the dominant frequency, the 9-11 Hz band.<br />
Training would involve using one electrode (channel C) at F3 and a second electrode<br />
(channel D) at F4 and encouraging an increase in comodulation between these sites.<br />
(With Neuroguide you would have seen hypo-coherence. You would use our screens to<br />
increase coherence.) Note also the marked functional isolation of the C3 site from much<br />
of the cortex at this frequency. Training at C3 would involve placing one electrode at C3<br />
and the second (and third and fourth) electrode at other sites such as F4 and encouraging<br />
an increase in comodulation (thanks are given to Dr. Sterman for his assistance in this<br />
analysis).<br />
Copyright ADD Centres Ltd. Prepublication – 1 st draft. Please do not copy. Dr. Thompson 905-803-8066 Canada 140
An alternative method: Without doing specific comodulation training one could use two<br />
channel training screens with channel C EEG on F3 to train down the dominant slow<br />
wave and channel D EEG on C4 to train up SMR. Then you could reverse this ‘crisscross’<br />
approach and train down the dominant slow wave at F4 and train up SMR<br />
frequencies at C3. We thank Dr. Sterman for this suggestion. He has found that<br />
comodulation usually then improves in future full-cap assessments. However, when<br />
Sterman and Kaiser release their formula for comodulation then screens to improve it<br />
may be more widely attempted and this could be a more efficient way of dealing with<br />
such findings. At present you can use Neuroguide (as an example) and use the MT<br />
COHERENCE screens with the infinity software, Coherence is clearly affected by head<br />
injury and there is more literatue on this.<br />
As a second example, many clients who exhibit the sensory aprosodia symptoms of<br />
Asperger’s syndrome will show a lack of comodulation between the right parietal area<br />
and the left frontal lobe and an increase of comodulation and coherence (perhaps a lack<br />
of discrimination of functions) between sites in the right cortex (P4, C4, F4).<br />
Comodulation and/or coherence training might also be considered in these clients.<br />
An important caution: At this time you should tell your client that training based on<br />
comodulation findings must be considered ‘experimental’ as there is not published<br />
literature in this area although initial reports in professional meetings are favourable and<br />
there are no known negative side effects.<br />
v. Hiding Screens:<br />
Copyright ADD Centres Ltd. Prepublication – 1 st draft. Please do not copy. Dr. Thompson 905-803-8066 Canada 141
Screens A1-1, A1-10, A1-11 and A1-2 all have the animation dependent on meeting all<br />
variables. These screens all have points and %>threshold for each of the variables. For<br />
some children (particularly younger children) you may feel that these extra measures<br />
clutter the screen, distract the child and do not add any useful information. It is easier to<br />
delete or hide unwanted instruments in this program than to make new instruments and<br />
we have made our screens ‘over-inclusive’ with this thought in mind. With our ‘overinclusive’<br />
screens you can just hide these instruments (click View in the top menu bar<br />
and then Hide <strong>Instruments</strong>). Alternatively, go to ‘edit’ and delete the unwanted<br />
instruments and rename the screen. Below is an example of how to ‘hide’ unwanted<br />
labels, numerics and counters from the maze screen.<br />
Click view and Hide <strong>Instruments</strong>. Now just check off the instruments you wish to hide as<br />
shown below.<br />
Copyright ADD Centres Ltd. Prepublication – 1 st draft. Please do not copy. Dr. Thompson 905-803-8066 Canada 142
vi. Some Further Notes about Screens<br />
Screen A1-12 CalmFocus is different from most of the other screens in that it uses the<br />
ratio of 3-7/SMR to run the car animation and the only inhibit is the 23-35 Hz bargraph<br />
which can be used to reflect muscle activity when this screen is used for feedback with<br />
children.<br />
The A1-31 skeleton shaping screen is used for shaping the child’s focus. The numerics<br />
for points and the %>threshold counters are not really that useful for most clients. Again<br />
we have been over-inclusive because it is relatively simple for you to hide extra<br />
instruments when they are not necessary for the process you are carrying out. The least<br />
number of distractions the better in most circumstances. The same comments apply to<br />
the other skeleton screens which emphasize shaping using different slow wave<br />
bandwidths.<br />
The A1d screen is actually a 2 monitor screen. You would only use it when you have a<br />
second monitor attached to your laptop.<br />
In A3-21, the two Balance Beam screen, we usually hide label #39 and numeric #38<br />
because they refer to the time above threshold for EMG activity. This screen shows the 2-<br />
40 Hz EEG and is very useful for some clients, particularly children, who follow the<br />
change in EEG activity rather than the animations. This gives them very fast feedback<br />
and we feel their learning is accelerated. Not all clients have quick enough visual<br />
perception to instantly follow that the EEG has suddenly switched to high amplitude slow<br />
wave meaning they must get back into focus.<br />
The A2-4 mouse walk screen is enjoyed by many children. However it requires the<br />
trainer to make it interesting by altering the thresholds so that the mice appear to be<br />
racing across the screen. The child is asked to focus on one of the two mice and have it<br />
win by becoming very calm or very focused respectively. The music should be put on to<br />
the instrument that governs the bandwidth the child is working on.<br />
_AA1 is the assessment screen we use for all clients but we have changed all the<br />
numeric values to averages because they are easier to follow than peak-peak as the EEG<br />
runs. They an be changed back if so desired. A second monitor will be made for this<br />
assessment screen. This invisible screen will contain a large number of linegraphs. This<br />
will mean that when the trainer reviews data using the screen and shades a segment of the<br />
EEG and requests statistics, many more stat values will be available. This is because, in<br />
this program, only those bands that are represented as linegraphs are shown in the<br />
statistics when a segment is shaded.<br />
Copyright ADD Centres Ltd. Prepublication – 1 st draft. Please do not copy. Dr. Thompson 905-803-8066 Canada 143
The AA3ss script stress assessment screen is used in the stress assessment. It comes up<br />
automatically when you request a script and then a stress assessment. We do not now use<br />
the 3Aassd dual monitor screen at our centre.<br />
B1-3 Scrambled words screen is a useful single monitor screen for 15-18 Hz and 3-7<br />
Hz. This is a useful left brain task and therefore should be raising the 15-18 Hz activity.<br />
B1-4 Eyes.scr is very slow and therefore useful when the client is doing a cognitive task.<br />
B3-1d TaskFocus can be used as a single monitor screen. We have had adult clients who<br />
wanted a great deal of information on the screen and who particularly liked to see several<br />
spectrums running for different ranges. These clients have done extremely well<br />
demonstrating that our insistence, at times, on keeping feedback screens simple without<br />
distractions, simply doesn’t cover all client needs.<br />
C1-C5 are useful single monitor screens for some adult clients. Look at these using an<br />
adult EEG and <strong>Bio</strong>feedback monitors that has been peviously recorded. Then make your<br />
own decision as to which ones may be most useful for your clients.<br />
C5 BusyCalm is an island sunset animation controlled by the ratio BusyBrain/SMR and<br />
it can be used as a single monitor screen<br />
D1-1 and D1-2 are both screens for adults and both can be used as single monitor<br />
screens. D1-1 and D1-2 are our client’s favourite screen.<br />
E2 screen is a good single channel screen for adults who like to follow the max<br />
amplitude (red bar) in the spectrum. In E2-1 the EMG and respiration help these<br />
individuals to relax, empty their mind of non-productive thoughts and attain a state of<br />
focused calm.<br />
Copyright ADD Centres Ltd. Prepublication – 1 st draft. Please do not copy. Dr. Thompson 905-803-8066 Canada 144
F screens are dual monitor screens where the client is to attempt to identify the mental<br />
state associated with increasing the amplitude of a given band and then with decreasing<br />
the amplitude of the same band.<br />
I1 is just the initial instruction screen for the script assessment<br />
The K screens are sailboat screens for 4-8 Hz, 11-12 Hz and 13-15 Hz activity. These<br />
screens are used to try and ‘sense’ the mental state that corresponds to the bandwidth in<br />
question. The other instruments on the screen probably should just be hidden so as not to<br />
distract from the primary purpose of these screens.<br />
R1 and R1-1 are stress assessment review screens. We use the R1 screen to review the<br />
data obtained from the stress assessment script protocol.<br />
S1 Alpha-Theta is a screen that can be used for alpha/theta feedback. You will want to<br />
experiment with different sounds to meet the needs of particular clients. Some people<br />
prefer just to have a pleasant sound when the cross-over is sustained and to eliminate the<br />
sounds from the other variables. These changes are easy to make using the screen editor<br />
as previous described.<br />
The UNIVERSAL screens have been described in the screen description section of this<br />
document. It is from these screens that you can develop almost any screen you feel would<br />
be useful for a particular client or group of clients.<br />
Copyright ADD Centres Ltd. Prepublication – 1 st draft. Please do not copy. Dr. Thompson 905-803-8066 Canada 145
vii. Installing New Up-Dated Programs<br />
After you install anew update you may, or may not, have to do the following: Go to<br />
windows explorer – program files – thought technology – and click on ‘Infiniti’. Scroll<br />
down on right side and come to “Modify” channel sets, screens, scripts and so on…<br />
Double click each of these and let them run.<br />
viii. A Game to Decrease Variability<br />
40 –20 – 10 – 5 Game<br />
1 st make a Universal fast points (every 0.5 seconds) screen. Use the “to AVI’ link to<br />
change the instrument settings to this new time for the ‘all points counter’. Now you can<br />
change the damper settings using the ‘edit’ in the menu bar at the top of the screen. Try<br />
changing from the default or ‘5’ to 2.5. Then they must get 20 points without any pause<br />
before you will change the damper to 1.5. Now they must get 10 points without a pause<br />
before you will again lower the damper value and speed up the feedback. Give a blue<br />
token each time they achieve each of the forgoing goals without any pause. Finally<br />
change the damper to 1 and have the client get 5 points without any pause and earn a<br />
white token each time they do it.<br />
ix. 2 Channel Excel Comparison – A special Sheet for the MT<br />
screens is being made at this time at TT by Frank to do this job.<br />
Means F3 F4<br />
Delta-Theta Mean 14.07 14.7<br />
3-10Hz Mean 16.27 17.43<br />
Theta Mean 11.84 12.75<br />
Thalpha Mean 9.56 10.04<br />
Low Alpha Mean 5.77 5.9<br />
High Alpha Mean 2.72 2.46<br />
F3 F4<br />
SMR Mean 3.32 3.28<br />
Wide Beta Mean 6.67 6.61<br />
Problem-solvng Mean 3.78 3.92<br />
Beta Mean 4.48 4.56<br />
Intensity Mean 4.53 4.02<br />
Busy-brain Mean 5.95 5.51<br />
Sheer Mean 1.93 1.8<br />
EMG noise Mean 1.95 1.83<br />
Copyright ADD Centres Ltd. Prepublication – 1 st draft. Please do not copy. Dr. Thompson 905-803-8066 Canada 146
F3<br />
F4<br />
:ThetaMean sq/WideBetaMean sq 3.15 3.72<br />
: Theta/Beta ratio Mean 2.64 2.79<br />
:Thalpha/Prob-solv ratio Mean 2.53 2.56<br />
: Prob-solving/SMR ratio Mean 1.14 1.2<br />
:Intensity/Thalpha ratio Mean 0.47 0.4<br />
Intensity/HiAlpha ratio Mean 1.66 1.63<br />
: Busy-brain/SMR ratio Mean 1.79 1.68<br />
The above was made by copying statistics from a 2 channel assessment into excel. The<br />
channel D values were then placed beside the channel C values and the columns labelled<br />
according to the sites being compared. In this case F3 was compared with F4. This person<br />
was certainly not depressed and F4 slow wave is > F3. The opposite would be expected<br />
in a depressed client.<br />
With the MT 2 channel sets we could analyse the data using the 1 Hz Channel set bin to<br />
compare specific frequencies.<br />
x. 2 Channel Special Excel Sheet<br />
Frank at Thought Technology has produced the first draft (shown below) of a sheet to<br />
compare 2channels. The terms F3 and F4 will be changed in a September update to read<br />
Chan C, Chan D. Then you will fill in the site you used for channel C and for channel D.<br />
(In procomp 2 and procomp + C becomes A and D becomes B).<br />
You put the data in exactly the same way you did for ‘export data’ using Franks single<br />
channel export sheet on page 20 called ‘Special Excel Summary Sheet’.<br />
Copyright ADD Centres Ltd. Prepublication – 1 st draft. Please do not copy. Dr. Thompson 905-803-8066 Canada 147
We will be talking about this a little more in future up-dates of Clinical Success.<br />
xi. ‘Power values’ and ‘Spectral Magnitudes’<br />
We advise you to skip this and come back to it<br />
after you have done a few sessions<br />
The Infiniti MT_AA Assessment Screen<br />
Contains: 1. peak-peak amplitude raw EEG<br />
2. peak – peak amplitude line-graph<br />
3. uV ‘mean’ values<br />
4. Magnitude in a spectrum which is the square root of magnitude in<br />
‘power’<br />
The Neuro-guide reports “Power”<br />
Copyright ADD Centres Ltd. Prepublication – 1 st draft. Please do not copy. Dr. Thompson 905-803-8066 Canada 148
Relationship between peak-peak uV, root-mean-square, power and magnitude<br />
Copyright ADD Centres Ltd. Prepublication – 1 st draft. Please do not copy. Dr. Thompson 905-803-8066 Canada 149
A. Lubar-Monastra calculations of “power” are completely different than the ‘power’<br />
calculatons in Neuroguide (Dr. R. Thatcher). Lubar – Monastra power is<br />
calculated in picawatts. These are microvolt means for your artifacted 3 minute<br />
assessment (using Stoelting Autogenics’ hardware with the A620 assessment<br />
program that was Lubar’s design) squared and then multiplied by 6.3 to give a<br />
picawatt power value. The power values, so derived, for 4-8 Hz is divided by the<br />
power value for 13-21 Hz to give the ratio that is used to compare normals with<br />
persons diagnosed with ADHD.<br />
Note: In the A620 program a ‘Spectrum’ y-axis might be say 550 pw.<br />
(This is a different calculation than R. Thatcher’s Neuro<strong>Guide</strong> (NG) power “units”).<br />
To compare the Lubar-Monastra ‘pw power’ values with Infiniti ‘magnitude’ on the y-<br />
axis of the Infiniti spectrum take the square root of the Lubar y-axis pw power, and<br />
divide by 6.3 and you will get a number between 2 and 6 which is about what we see on<br />
the Infiniti y-axis of the spectrum on the assessment screen.<br />
B. Thatcher calculates “power” by doing the following:<br />
1. Change peak-peak, which is what we look at in most of our feedback<br />
programs, and change it to “root-mean-square”. Think of this as a way of<br />
measuring the area under the waves. The root-mean-square calculation<br />
looks only at the top half, that is the positive half, of the EEG waves. The<br />
amplitude of the top half of the wave is about ½ of the total peak to peak<br />
amplitude. This quantity is then squared to give a “power” value.<br />
2. In fact, however, as is outlined below, it is not quite this simple and more<br />
calculations must be done to give a true “power” value that we can use as<br />
a positive power measurements (y-axis) in a FFT spectrum (1 Hz bin<br />
histogram) that we can look at to see where most of the power is for our<br />
client.<br />
3. Some programs leave the y-axis as power and there are very large<br />
numbers on this histogram (Ex. The A620 histogram which uses a<br />
different power ‘unit’, picawatts). Other programs take the square root of<br />
this and use a “uv magnitude” figure for the y-axis and this is a much,<br />
much smaller number. (Magnitude refers to the average amplitude over<br />
time.)<br />
4. To calculate Neuroguide “power” take the peak-peak microvolt (uv) value<br />
and divide by 2 because the microvolt positive portion of the wave above<br />
the 0 line is half the total wave. (True for sine waves and approximately<br />
true for EEG waves which are more variable.) This is then squared to give<br />
“power”. This division by 2 and squaring is called “rectification” of the<br />
signal.<br />
5. However, the above is insufficient. It is not sufficient because waves rise<br />
and fall and there are spaces between the waves. The area we just<br />
calculated is therefore including these spaces and our calculated power<br />
should be a lower number. Bob Thatcher notes that this is correcting for<br />
Copyright ADD Centres Ltd. Prepublication – 1 st draft. Please do not copy. Dr. Thompson 905-803-8066 Canada 150
the "picket-fence" shape of the rectified signal and RMS. The actual<br />
correction is to multiply the squared value x 0.707.<br />
6. We still have a problem. The signal is “recognized” by the program in<br />
segments or “epochs” called” windows. This process is done in a<br />
procedure called “windowing”.<br />
These “windows” overlap. This process means that we must make another<br />
correction. Dr Thatcher says, “windowing is about a 20% reduction of signal<br />
using a cosine taper and about a 50% reduction using a Hanning window.”<br />
(should this be Hamming?) The correction factor in Neuroguide is to multiply<br />
our value above by 0.57. This is called a “windowing factor”.<br />
7. Thus to summarize:<br />
(peak-peak uv / 2) 2 x 0.707 x 0.57 = power<br />
8. To now change this value back to “uv magnitude” we must take the square<br />
root of it to see the “magnitude value” as seen on the ‘y’ axis of the<br />
spectrum we use in our feedback program.<br />
Case Example:<br />
Take a child and his mean value for theta say is 24.78 uV on the Infiniti.<br />
24.78/2= 12.3936 squared =153.60 x .57 =87.5531 x .707 = 61.90 which is the value seen<br />
in NG for power.<br />
Reverse the process and work back from the Thatcher NG report value for FFT power<br />
(uV) 2 :<br />
1/.57 =1.7544<br />
1/.707 = 1.4144<br />
Now take 62 x 1.7516 = 108.5992 x1.4144= 153.6027 and then take the square root of<br />
153.6027 =12.39365 and this is the baseline to peak value. This needs to be doubled if<br />
you want the peak to peak value. It would then be 24.78<br />
This would correspond to our Infiniti ‘mean’ for theta.<br />
Index<br />
This is not given for in Word for Windows you can enter edit and use find in order to find<br />
any item in the text. We have tried to make the Table of Contents complete enough that<br />
things can be found easily.<br />
Copyright ADD Centres Ltd. Prepublication – 1 st draft. Please do not copy. Dr. Thompson 905-803-8066 Canada 151
ix. Optimize Athletic Performance<br />
Suggestions given to director of AC MILAN MIND<br />
ROOM<br />
From the Montreal Gazette:<br />
The Gazette, Published: Saturday, July 08, 2006<br />
When Italy plays against France tomorrow in the World Cup final, some of its best<br />
players will be relying on a secret weapon. Shoes with special cleats? No. Shorts that<br />
make a forward run faster? Not really. Rather, the secret weapon in question is called the<br />
Mind Room and it was developed in Montreal.<br />
IMPORTANT NOTE: In the following the reporter has used the term “meditative state”<br />
where we use a series of descriptive words: calm, relaxed, open awareness without any<br />
internal dialogue until they specifically focus on visualizing an area of the game and then<br />
only that area is in their conscious mind.<br />
For months now, at least four players on the Italian national team have been training in<br />
the Mind Room to prepare themselves mentally for clutch moments in the World Cup.<br />
Although the Mind Room is located in Italy, the biofeedback equipment was invented by<br />
Thought Technology Ltd. of Montreal.<br />
"These guys have been trained by Bruno De Michelis, the head of sport science of AC<br />
Milan, to be able to focus, to concentrate and to get into the zone for their peak<br />
performance," "There is no question that mental preparation is the key difference,<br />
because these guys are all extraordinarily fit and talented. Our instrumentation helps<br />
the athletes reach that optimal state of mind."<br />
In the Mind Room, the athletes lie on reclining chairs, their bodies strapped to the<br />
ProComp device that measures seven physiological signs - from their brain waves and<br />
muscle tension to their breathing and heart rate. De Michelis then trains them to use their<br />
minds to reach a meditative state.<br />
The next step is to teach the athletes to maintain that state while visualizing in their minds<br />
their athletic performance. They often watch videos of their performances on the pitch.<br />
If they have a particular problem - like missing a penalty kick or hitting the crossbar - De<br />
Michelis will train them to relax mentally. He does this by first getting them into the<br />
meditative state, then showing them a video of their flawed performance for a couple of<br />
seconds. Naturally, their muscles will immediately tense and their blood pressure will go<br />
up as they watch the missed goal, but De Michelis will get them to relax again.<br />
The psychologist will repeat this until the player can watch the flawed performance from<br />
start to finish while maintaining the meditative state.<br />
Copyright ADD Centres Ltd. Prepublication – 1 st draft. Please do not copy. Dr. Thompson 905-803-8066 Canada 152
The idea is that when they go out on the pitch and have to make the penalty kick, they'll<br />
be so focused, so prepared mentally, that they won't miss. They'll be able to bring down<br />
their heart rate when they don't have to run to conserve energy, and they'll do that without<br />
even thinking.<br />
"The athletes will be able to reach that state of mind when presented with ch allenges,"<br />
offered Hal Myers, the inventor of ProComp, who holds a doctorate in experimental<br />
medicine and is a part-time collector of Victorian-era medical equipment that adorns his<br />
office.<br />
The Thompson, <strong>Bio</strong>feedback Institute contribution with Dr. Vietta Sue Wilson, was<br />
screen design and method. An outline and sample screen is shown below.<br />
BASIC CONCEPTS (1 st draft)<br />
I. Sleep, exercise and diet<br />
II. Compartmentalize: None of outside life comes into compound<br />
then<br />
III. Psychophysiological / Mental Assessment & Training<br />
A. Establish the brain wave signature of the successful athlete<br />
B. Establish differences between peak days and off days for the individual<br />
player<br />
C. Set up individual plan for each player (nothing should be assumed)<br />
D. Training<br />
1. Athlete practices: Visualizing perfect play while doing the following:<br />
a. Relaxation – respiration, pulse, respiratory sinus arrhythmia,<br />
temperature, skin conduction, muscle<br />
b. Practice altering mental state to become conscious of the<br />
relationship between state and bargraph representing a series of<br />
bandwidths. Use visualizing and /or inner dialogue to produce<br />
different metal states.<br />
2. Athlete must achieve and sustain calm open awareness state then practice<br />
flexibility moving in and out of narrow external focus.<br />
E. Combine measurements and training while in virtual reality of appropriate<br />
stress situations and then visualizing perfect solution for each individual<br />
athlete for each situation<br />
F. Practice calm open awareness when off field<br />
The Screen used is from the “F” group.<br />
Copyright ADD Centres Ltd. Prepublication – 1 st draft. Please do not copy. Dr. Thompson 905-803-8066 Canada 153
This is a ‘dual monitor’ screen but only the Trainer Monitor is shown for ease of<br />
description. The first of the ‘F’ screens shows the two balance beams on the second<br />
monitor and the trainer monitor has a bargraph in the upper left corner for 3-10 Hz.<br />
The Top balance beam ball only moves if the criteria are met for<br />
calm open awareness (the bottom balance beam ball to right)<br />
The ‘key’ to NFB training is to have the athlete achieve and sustain<br />
calm open awareness state then practice flexibility moving in and out<br />
of narrow external focus.<br />
***********************************************************************<br />
Acknowledgement:<br />
Special thanks are given to Andrea Reid for her work on the use of Excel and staff<br />
recording sheets.<br />
Copyright ADD Centres Ltd. Prepublication – 1 st draft. Please do not copy. Dr. Thompson 905-803-8066 Canada 154