CFOs: Surviving in a New Era - AGA
CFOs: Surviving in a New Era - AGA
CFOs: Surviving in a New Era - AGA

Create successful ePaper yourself
Turn your PDF publications into a flip-book with our unique Google optimized e-Paper software.
17<br />
• Bus<strong>in</strong>ess Intelligence (BI) software, <strong>in</strong>clud<strong>in</strong>g<br />
for data m<strong>in</strong><strong>in</strong>g and data warehouses (typically,<br />
this is commercial off-the-shelf software<br />
(COTS) for enterprise resource plann<strong>in</strong>g<br />
(ERP) with a BI module)<br />
• Cost track<strong>in</strong>g and analysis<br />
• Geospatial analysis to track claims<br />
and predict potential overpayments<br />
or fraudulent payments<br />
• More sophisticated analyses: Uncerta<strong>in</strong>ty<br />
(Monte Carlo), regression<br />
• Monitor<strong>in</strong>g problem report logs<br />
Although a few federal entities are well advanced<br />
<strong>in</strong> the use of predictive and statistical analysis<br />
<strong>in</strong> the f<strong>in</strong>ancial and nonf<strong>in</strong>ancial arenas, for the<br />
most part departments and their components<br />
are <strong>in</strong> the very early stages of us<strong>in</strong>g these tools.<br />
Quite a few do not use them at all, accord<strong>in</strong>g<br />
to our respondents.<br />
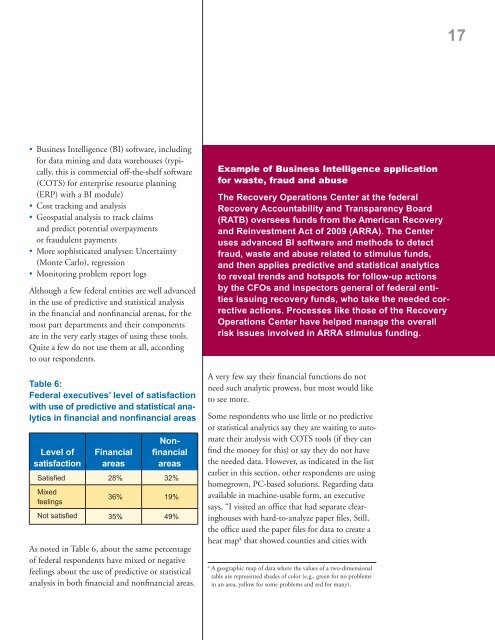
Table 6:<br />
Federal executives’ level of satisfaction<br />
with use of predictive and statistical analytics<br />
<strong>in</strong> f<strong>in</strong>ancial and nonf<strong>in</strong>ancial areas<br />
Level of<br />
satisfaction<br />
F<strong>in</strong>ancial<br />
areas<br />
Nonf<strong>in</strong>ancial<br />
areas<br />
Satisfied 28% 32%<br />
Mixed<br />
feel<strong>in</strong>gs<br />
36% 19%<br />
Not satisfied 35% 49%<br />
As noted <strong>in</strong> Table 6, about the same percentage<br />
of federal respondents have mixed or negative<br />
feel<strong>in</strong>gs about the use of predictive or statistical<br />
analysis <strong>in</strong> both f<strong>in</strong>ancial and nonf<strong>in</strong>ancial areas.<br />
Example of Bus<strong>in</strong>ess Intelligence application<br />
for waste, fraud and abuse<br />
The Recovery Operations Center at the federal<br />
Recovery Accountability and Transparency Board<br />
(RATB) oversees funds from the American Recovery<br />
and Re<strong>in</strong>vestment Act of 2009 (ARRA). The Center<br />
uses advanced BI software and methods to detect<br />
fraud, waste and abuse related to stimulus funds,<br />
and then applies predictive and statistical analytics<br />
to reveal trends and hotspots for follow-up actions<br />
by the <strong>CFOs</strong> and <strong>in</strong>spectors general of federal entities<br />
issu<strong>in</strong>g recovery funds, who take the needed corrective<br />
actions. Processes like those of the Recovery<br />
Operations Center have helped manage the overall<br />
risk issues <strong>in</strong>volved <strong>in</strong> ARRA stimulus fund<strong>in</strong>g.<br />
A very few say their f<strong>in</strong>ancial functions do not<br />
need such analytic prowess, but most would like<br />
to see more.<br />
Some respondents who use little or no predictive<br />
or statistical analytics say they are wait<strong>in</strong>g to automate<br />
their analysis with COTS tools (if they can<br />
f<strong>in</strong>d the money for this) or say they do not have<br />
the needed data. However, as <strong>in</strong>dicated <strong>in</strong> the list<br />
earlier <strong>in</strong> this section, other respondents are us<strong>in</strong>g<br />
homegrown, PC-based solutions. Regard<strong>in</strong>g data<br />
available <strong>in</strong> mach<strong>in</strong>e-usable form, an executive<br />
says, “I visited an office that had separate clear<strong>in</strong>ghouses<br />
with hard-to-analyze paper files. Still,<br />
the office used the paper files for data to create a<br />
heat map 4 that showed counties and cities with<br />
4<br />
A geographic map of data where the values of a two-dimensional<br />
table are represented shades of color (e.g., green for no problems<br />
<strong>in</strong> an area, yellow for some problems and red for many).