Annual Report 2002 - Agfa
Annual Report 2002 - Agfa
Annual Report 2002 - Agfa

Create successful ePaper yourself
Turn your PDF publications into a flip-book with our unique Google optimized e-Paper software.
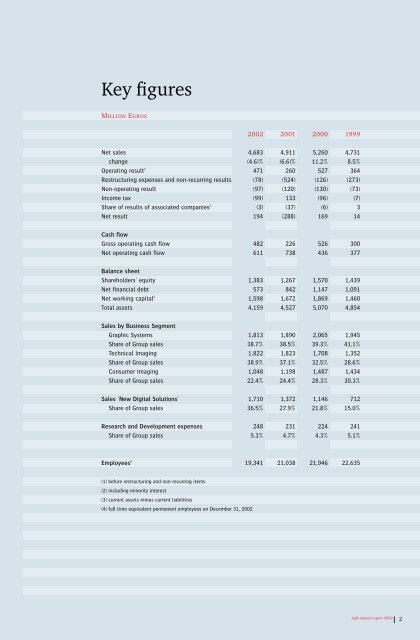
Key figures<br />
MILLION EUROS<br />
<strong>2002</strong> 2001 2000 1999<br />
Net sales 4,683 4,911 5,260 4,731<br />
change (4.6)% (6.6)% 11.2% 8.5%<br />
Operating result 1 471 260 527 364<br />
Restructuring expenses and non-recurring results (78) (524) (126) (273)<br />
Non-operating result (97) (120) (130) (73)<br />
Income tax (99) 133 (96) (7)<br />
Share of results of associated companies 2 (3) (37) (6) 3<br />
Net result 194 (288) 169 14<br />
Cash flow<br />
Gross operating cash flow 482 226 526 300<br />
Net operating cash flow 611 738 436 377<br />
Balance sheet<br />
Shareholders' equity 1,383 1,267 1,570 1,439<br />
Net financial debt 573 842 1,147 1,091<br />
Net working capital 3 1,598 1,672 1,869 1,460<br />
Total assets 4,159 4,527 5,070 4,854<br />
Sales by Business Segment<br />
Graphic Systems 1,813 1,890 2,065 1,945<br />
Share of Group sales 38.7% 38.5% 39.3% 41.1%<br />
Technical Imaging 1,822 1,823 1,708 1,352<br />
Share of Group sales 38.9% 37.1% 32.5% 28.6%<br />
Consumer Imaging 1,048 1,198 1,487 1,434<br />
Share of Group sales 22.4% 24.4% 28.3% 30.3%<br />
Sales 'New Digital Solutions' 1,710 1,372 1,146 712<br />
Share of Group sales 36.5% 27.9% 21.8% 15.0%<br />
Research and Development expenses 248 231 224 241<br />
Share of Group sales 5.3% 4.7% 4.3% 5.1%<br />
Employees 4 19,341 21,038 21,946 22,635<br />
(1) before restructuring and non-recurring items<br />
(2) including minority interest<br />
(3) current assets minus current liabilities<br />
(4) full time equivalent permanent employees on December 31, <strong>2002</strong><br />
<strong>Agfa</strong> annual report <strong>2002</strong><br />
2