Create successful ePaper yourself
Turn your PDF publications into a flip-book with our unique Google optimized e-Paper software.
4.2 COMMON OBJECTS. 14<br />
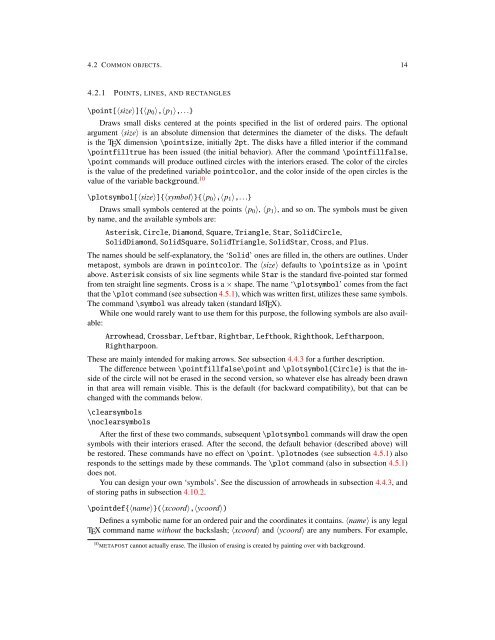
4.2.1 POINTS, LINES, AND RECTANGLES<br />
\point[〈size〉]{〈p 0 〉,〈p 1 〉,...}<br />
Draws small disks centered at the points specified in the list of ordered pairs. The optional<br />
argument 〈size〉 is an absolute dimension that determines the diameter of the disks. The default<br />
is the TEX dimension \pointsize, initially 2pt. The disks have a filled interior if the command<br />
\pointfilltrue has been issued (the initial behavior). After the command \pointfillfalse,<br />
\point commands will produce outlined circles with the interiors erased. The color of the circles<br />
is the value of the predefined variable pointcolor, and the color inside of the open circles is the<br />
value of the variable background. 10<br />
\plotsymbol[〈size〉]{〈symbol〉}{〈p 0 〉,〈p 1 〉,...}<br />
Draws small symbols centered at the points 〈p 0 〉, 〈p 1 〉, and so on. The symbols must be given<br />
by name, and the available symbols are:<br />
Asterisk, Circle, Diamond, Square, Triangle, Star, SolidCircle,<br />
SolidDiamond, SolidSquare, SolidTriangle, SolidStar, Cross, and Plus.<br />
The names should be self-explanatory, the ‘Solid’ ones are filled in, the others are outlines. Under<br />
metapost, symbols are drawn in pointcolor. The 〈size〉 defaults to \pointsize as in \point<br />
above. Asterisk consists of six line segments while Star is the standard five-pointed star formed<br />
from ten straight line segments. Cross is a × shape. The name ‘\plotsymbol’ comes from the fact<br />
that the \plot command (see subsection 4.5.1), which was written first, utilizes these same symbols.<br />
The command \symbol was already taken (standard LATEX).<br />
While one would rarely want to use them for this purpose, the following symbols are also available:<br />
Arrowhead, Crossbar, Leftbar, Rightbar, Lefthook, Righthook, Leftharpoon,<br />
Rightharpoon.<br />
These are mainly intended for making arrows. See subsection 4.4.3 for a further description.<br />
The difference between \pointfillfalse\point and \plotsymbol{Circle} is that the inside<br />
of the circle will not be erased in the second version, so whatever else has already been drawn<br />
in that area will remain visible. This is the default (for backward compatibility), but that can be<br />
changed with the commands below.<br />
\clearsymbols<br />
\noclearsymbols<br />
After the first of these two commands, subsequent \plotsymbol commands will draw the open<br />
symbols with their interiors erased. After the second, the default behavior (described above) will<br />
be restored. These commands have no effect on \point. \plotnodes (see subsection 4.5.1) also<br />
responds to the settings made by these commands. The \plot command (also in subsection 4.5.1)<br />
does not.<br />
You can design your own ‘symbols’. See the discussion of arrowheads in subsection 4.4.3, and<br />
of storing paths in subsection 4.10.2.<br />
\pointdef{〈name〉}(〈xcoord〉,〈ycoord〉)<br />
Defines a symbolic name for an ordered pair and the coordinates it contains. 〈name〉 is any legal<br />
TEX command name without the backslash; 〈xcoord〉 and 〈ycoord〉 are any numbers. For example,<br />
10 METAPOST cannot actually erase. The illusion of erasing is created by painting over with background.


