Create successful ePaper yourself
Turn your PDF publications into a flip-book with our unique Google optimized e-Paper software.
4.7 LABELS AND CAPTIONS. 49<br />
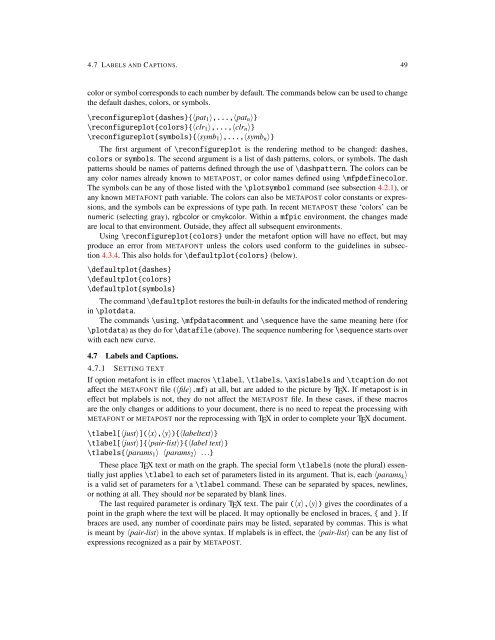
color or symbol corresponds to each number by default. The commands below can be used to change<br />
the default dashes, colors, or symbols.<br />
\reconfigureplot{dashes}{〈pat 1 〉,...,〈pat n 〉}<br />
\reconfigureplot{colors}{〈clr 1 〉,...,〈clr n 〉}<br />
\reconfigureplot{symbols}{〈symb 1 〉,...,〈symb n 〉}<br />
The first argument of \reconfigureplot is the rendering method to be changed: dashes,<br />
colors or symbols. The second argument is a list of dash patterns, colors, or symbols. The dash<br />
patterns should be names of patterns defined through the use of \dashpattern. The colors can be<br />
any color names already known to METAPOST, or color names defined using \mfpdefinecolor.<br />
The symbols can be any of those listed with the \plotsymbol command (see subsection 4.2.1), or<br />
any known METAFONT path variable. The colors can also be METAPOST color constants or expressions,<br />
and the symbols can be expressions of type path. In recent METAPOST these ‘colors’ can be<br />
numeric (selecting gray), rgbcolor or cmykcolor. Within a <strong>mfpic</strong> environment, the changes made<br />
are local to that environment. Outside, they affect all subsequent environments.<br />
Using \reconfigureplot{colors} under the metafont option will have no effect, but may<br />
produce an error from METAFONT unless the colors used conform to the guidelines in subsection<br />
4.3.4. This also holds for \defaultplot{colors} (below).<br />
\defaultplot{dashes}<br />
\defaultplot{colors}<br />
\defaultplot{symbols}<br />
The command \defaultplot restores the built-in defaults for the indicated method of rendering<br />
in \plotdata.<br />
The commands \using, \mfpdatacomment and \sequence have the same meaning here (for<br />
\plotdata) as they do for \datafile (above). The sequence numbering for \sequence starts over<br />
with each new curve.<br />
4.7 Labels and Captions.<br />
4.7.1 SETTING TEXT<br />
If option metafont is in effect macros \tlabel, \tlabels, \axislabels and \tcaption do not<br />
affect the METAFONT file (〈file〉.mf) at all, but are added to the picture by TEX. If metapost is in<br />
effect but mplabels is not, they do not affect the METAPOST file. In these cases, if these macros<br />
are the only changes or additions to your <strong>doc</strong>ument, there is no need to repeat the processing with<br />
METAFONT or METAPOST nor the reprocessing with TEX in order to complete your TEX <strong>doc</strong>ument.<br />
\tlabel[〈just〉](〈x〉,〈y〉){〈labeltext〉}<br />
\tlabel[〈just〉]{〈pair-list〉}{〈label text〉}<br />
\tlabels{〈params 1 〉 〈params 2 〉 ...}<br />
These place TEX text or math on the graph. The special form \tlabels (note the plural) essentially<br />
just applies \tlabel to each set of parameters listed in its argument. That is, each 〈params k 〉<br />
is a valid set of parameters for a \tlabel command. These can be separated by spaces, newlines,<br />
or nothing at all. They should not be separated by blank lines.<br />
The last required parameter is ordinary TEX text. The pair (〈x〉,〈y〉) gives the coordinates of a<br />
point in the graph where the text will be placed. It may optionally be enclosed in braces, { and }. If<br />
braces are used, any number of coordinate pairs may be listed, separated by commas. This is what<br />
is meant by 〈pair-list〉 in the above syntax. If mplabels is in effect, the 〈pair-list〉 can be any list of<br />
expressions recognized as a pair by METAPOST.


