2010 annual report - touax group
2010 annual report - touax group
2010 annual report - touax group
You also want an ePaper? Increase the reach of your titles
YUMPU automatically turns print PDFs into web optimized ePapers that Google loves.
Annual <strong>report</strong> <strong>2010</strong><br />
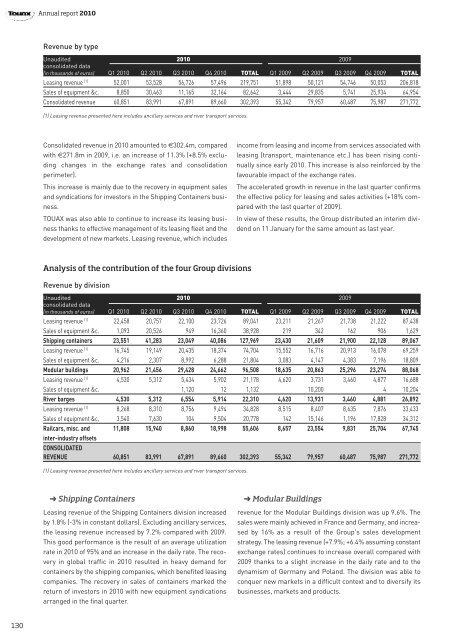
Revenue by type<br />
Unaudited <strong>2010</strong> 2009<br />
consolidated data<br />
(in thousands of euros) Q1 <strong>2010</strong> Q2 <strong>2010</strong> Q3 <strong>2010</strong> Q4 <strong>2010</strong> TOTAL Q1 2009 Q2 2009 Q3 2009 Q4 2009 TOTAL<br />
Leasing revenue (1) 52,001 53,528 56,726 57,496 219,751 51,898 50,121 54,746 50,053 206,818<br />
Sales of equipment &c. 8,850 30,463 11,165 32,164 82,642 3,444 29,835 5,741 25,934 64,954<br />
Consolidated revenue 60,851 83,991 67,891 89,660 302,393 55,342 79,957 60,487 75,987 271,772<br />
(1) Leasing revenue presented here includes ancillary services and river transport services.<br />
Consolidated revenue in <strong>2010</strong> amounted to €302.4m, compared<br />
with €271.8m in 2009, i.e. an increase of 11.3% (+8.5% excluding<br />
changes in the exchange rates and consolidation<br />
perimeter).<br />
This increase is mainly due to the recovery in equipment sales<br />
and syndications for investors in the Shipping Containers business.<br />
TOUAX was also able to continue to increase its leasing business<br />
thanks to effective management of its leasing fleet and the<br />
development of new markets. Leasing revenue, which includes<br />
income from leasing and income from services associated with<br />
leasing (transport, maintenance etc.) has been rising continually<br />
since early <strong>2010</strong>. This increase is also reinforced by the<br />
favourable impact of the exchange rates.<br />
The accelerated growth in revenue in the last quarter confirms<br />
the effective policy for leasing and sales activities (+18% compared<br />
with the last quarter of 2009).<br />
In view of these results, the Group distributed an interim dividend<br />
on 11 January for the same amount as last year.<br />
Analysis of the contribution of the four Group divisions<br />
Revenue by division<br />
Unaudited <strong>2010</strong> 2009<br />
consolidated data<br />
(in thousands of euros) Q1 <strong>2010</strong> Q2 <strong>2010</strong> Q3 <strong>2010</strong> Q4 <strong>2010</strong> TOTAL Q1 2009 Q2 2009 Q3 2009 Q4 2009 TOTAL<br />
Leasing revenue (1) 22,458 20,757 22,100 23,726 89,041 23,211 21,267 21,738 21,222 87,438<br />
Sales of equipment &c. 1,093 20,526 949 16,360 38,928 219 342 162 906 1,629<br />
Shipping containers 23,551 41,283 23,049 40,086 127,969 23,430 21,609 21,900 22,128 89,067<br />
Leasing revenue (1) 16,745 19,149 20,435 18,374 74,704 15,552 16,716 20,913 16,078 69,259<br />
Sales of equipment &c. 4,216 2,307 8,992 6,288 21,804 3,083 4,147 4,383 7,196 18,809<br />
Modular buildings 20,962 21,456 29,428 24,662 96,508 18,635 20,863 25,296 23,274 88,068<br />
Leasing revenue (1) 4,530 5,312 5,434 5,902 21,178 4,620 3,731 3,460 4,877 16,688<br />
Sales of equipment &c. 1,120 12 1,132 10,200 4 10,204<br />
River barges 4,530 5,312 6,554 5,914 22,310 4,620 13,931 3,460 4,881 26,892<br />
Leasing revenue (1) 8,268 8,310 8,756 9,494 34,828 8,515 8,407 8,635 7,876 33,433<br />
Sales of equipment &c. 3,540 7,630 104 9,504 20,778 142 15,146 1,196 17,828 34,312<br />
Railcars, misc. and 11,808 15,940 8,860 18,998 55,606 8,657 23,554 9,831 25,704 67,745<br />
inter-industry offsets<br />
CONSOLIDATED<br />
REVENUE 60,851 83,991 67,891 89,660 302,393 55,342 79,957 60,487 75,987 271,772<br />
(1) Leasing revenue presented here includes ancillary services and river transport services.<br />
➜ Shipping Containers<br />
Leasing revenue of the Shipping Containers division increased<br />
by 1.8% (-3% in constant dollars). Excluding ancillary services,<br />
the leasing revenue increased by 7.2% compared with 2009.<br />
This good performance is the result of an average utilization<br />
rate in <strong>2010</strong> of 95% and an increase in the daily rate. The recovery<br />
in global traffic in <strong>2010</strong> resulted in heavy demand for<br />
containers by the shipping companies, which benefited leasing<br />
companies. The recovery in sales of containers marked the<br />
return of investors in <strong>2010</strong> with new equipment syndications<br />
arranged in the final quarter.<br />
➜ Modular Buildings<br />
revenue for the Modular Buildings division was up 9.6%. The<br />
sales were mainly achieved in France and Germany, and increased<br />
by 16% as a result of the Group's sales development<br />
strategy. The leasing revenue (+7.9%; +6.4% assuming constant<br />
exchange rates) continues to increase overall compared with<br />
2009 thanks to a slight increase in the daily rate and to the<br />
dynamism of Germany and Poland. The division was able to<br />
conquer new markets in a difficult context and to diversify its<br />
businesses, markets and products.<br />
130


