Financial Statements - United Bank Limited
Financial Statements - United Bank Limited
Financial Statements - United Bank Limited

Create successful ePaper yourself
Turn your PDF publications into a flip-book with our unique Google optimized e-Paper software.
NOTES TO AND FORMING PART OF THE UNCONSOLIDATED FINANCIAL STATEMENTS<br />
FOR THE YEAR ENDED DECEMBER 31, 2012<br />
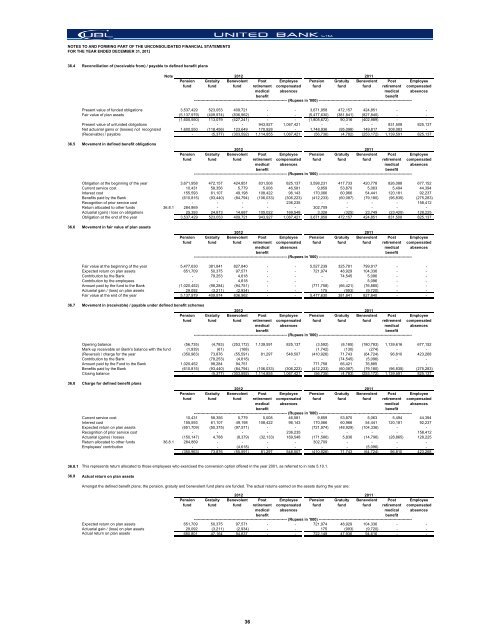
36.4 Reconciliation of (receivable from) / payable to defined benefit plans<br />
Note<br />
Pension<br />
fund<br />
Gratuity<br />
fund<br />
2012 2011<br />
Benevolent<br />
fund<br />
Post<br />
retirement<br />
medical<br />
benefit<br />
Employee<br />
compensated<br />
absences<br />
Pension<br />
fund<br />
Gratuity<br />
fund<br />
Benevolent<br />
fund<br />
Post<br />
retirement<br />
medical<br />
benefit<br />
------------------------------------------------------------------------ (Rupees in '000) ------------------------------------------------------------------------<br />
Employee<br />
compensated<br />
absences<br />
Present value of funded obligations 3,537,429 523,053 409,721 - - 3,671,958 472,157 424,851 - -<br />
Fair value of plan assets (5,137,979) (409,974) (836,962) - - (5,477,630) (381,841) (827,840) - -<br />
(1,600,550) 113,079 (427,241) - - (1,805,672) 90,316 (402,989) - -<br />
Present value of unfunded obligations - - - 943,927 1,067,421 - - - 831,508 825,137<br />
Net actuarial gains or (losses) not recognized 1,600,550 (118,456) 123,649 170,928 - 1,748,936 (95,098) 149,817 308,083 -<br />
(Receivable) / payable - (5,377) (303,592) 1,114,855 1,067,421 (56,736) (4,782) (253,172) 1,139,591 825,137<br />
36.5 Movement in defined benefit obligations<br />
Pension<br />
fund<br />
Gratuity<br />
fund<br />
2012 2011<br />
Benevolent<br />
fund<br />
Post<br />
retirement<br />
medical<br />
benefit<br />
Employee<br />
compensated<br />
absences<br />
Pension<br />
fund<br />
Gratuity<br />
fund<br />
Benevolent<br />
fund<br />
Post<br />
retirement<br />
medical<br />
benefit<br />
------------------------------------------------------------------------ (Rupees in '000) ------------------------------------------------------------------------<br />
Employee<br />
compensated<br />
absences<br />
Obligation at the beginning of the year 3,671,958 472,157 424,851 831,508 825,137 3,598,231 417,733 420,778 826,088 677,152<br />
Current service cost 10,431 58,356 5,779 5,008 46,581 9,859 53,870 5,063 5,494 44,394<br />
Interest cost 155,593 61,107 49,198 108,422 96,143 170,066 60,966 54,441 120,181 92,237<br />
Benefits paid by the <strong>Bank</strong> (610,815) (93,440) (84,794) (106,033) (306,223) (412,233) (60,087) (79,180) (96,835) (275,283)<br />
Recognition of prior service cost - - - - 236,235 - - - - 158,412<br />
Return allocated to other funds 36.8.1 284,869 - - - - 302,709 - - - -<br />
Actuarial (gain) / loss on obligations 25,393 24,873 14,687 105,022 169,548 3,326 (325) 23,749 (23,420) 128,225<br />
Obligation at the end of the year 3,537,429 523,053 409,721 943,927 1,067,421 3,671,958 472,157 424,851 831,508 825,137<br />
36.6 Movement in fair value of plan assets<br />
Pension<br />
fund<br />
Gratuity<br />
fund<br />
2012<br />
Benevolent<br />
fund<br />
Post<br />
retirement<br />
medical<br />
benefit<br />
Employee<br />
compensated<br />
absences<br />
Pension<br />
fund<br />
Gratuity<br />
fund<br />
2011<br />
Benevolent<br />
fund<br />
Post<br />
retirement<br />
medical<br />
benefit<br />
------------------------------------------------------------------------ (Rupees in '000) ------------------------------------------------------------------------<br />
Employee<br />
compensated<br />
absences<br />
Fair value at the beginning of the year 5,477,630 381,841 827,840 - - 5,527,239 325,781 799,917 - -<br />
Expected return on plan assets 651,709 50,375 97,571 - - 721,974 48,929 104,336 - -<br />
Contribution by the <strong>Bank</strong> - 79,253 4,618 - - - 74,545 5,096 - -<br />
Contribution by the employees - - 4,618 - - - - 5,096 - -<br />
Amount paid by the fund to the <strong>Bank</strong> (1,020,452) (98,284) (94,751) - - (771,758) (66,421) (76,885) - -<br />
Actuarial gain / (loss) on plan assets 29,092 (3,211) (2,934) - - 175 (993) (9,720) - -<br />
Fair value at the end of the year 5,137,979 409,974 836,962 - - 5,477,630 381,841 827,840 - -<br />
36.7 Movement in (receivable) / payable under defined benefit schemes<br />
Pension<br />
fund<br />
Gratuity<br />
fund<br />
2012 2011<br />
Benevolent<br />
fund<br />
Post<br />
retirement<br />
medical<br />
benefit<br />
Employee<br />
compensated<br />
absences<br />
Pension<br />
fund<br />
Gratuity<br />
fund<br />
Benevolent<br />
fund<br />
Post<br />
retirement<br />
medical<br />
benefit<br />
Employee<br />
compensated<br />
absences<br />
Opening balance (56,735) (4,783) (253,172) 1,139,591 825,137 (3,592) (8,185) (180,783) 1,139,616 677,152<br />
Mark-up receivable on <strong>Bank</strong>'s balance with the fund (1,939) (61) (168) - - (1,742) (130) (274) - -<br />
(Reversal) / charge for the year (350,963) 73,876 (55,591) 81,297 548,507 (410,926) 71,743 (64,724) 96,810 423,268<br />
Contribution by the <strong>Bank</strong> - (79,253) (4,618) - - - (74,545) (5,096) - -<br />
Amount paid by the Fund to the <strong>Bank</strong> 1,020,452 98,284 94,751 - - 771,758 66,421 76,885 - -<br />
Benefits paid by the <strong>Bank</strong> (610,815) (93,440) (84,794) (106,033) (306,223) (412,233) (60,087) (79,180) (96,835) (275,283)<br />
Closing balance - (5,377) (303,592) 1,114,855 1,067,421 (56,735) (4,783) (253,172) 1,139,591 825,137<br />
36.8 Charge for defined benefit plans<br />
Pension<br />
fund<br />
------------------------------------------------------------------------ (Rupees in '000) ------------------------------------------------------------------------<br />
Gratuity<br />
fund<br />
2012 2011<br />
Benevolent<br />
fund<br />
Post<br />
retirement<br />
medical<br />
benefit<br />
Employee<br />
compensated<br />
absences<br />
Pension<br />
fund<br />
Gratuity<br />
fund<br />
Benevolent<br />
fund<br />
Post<br />
retirement<br />
medical<br />
benefit<br />
Employee<br />
compensated<br />
absences<br />
------------------------------------------------------------------------ (Rupees in '000) ------------------------------------------------------------------------<br />
Current service cost 10,431 58,356 5,779 5,008 46,581 9,859 53,870 5,063 5,494 44,394<br />
Interest cost 155,593 61,107 49,198 108,422 96,143 170,066 60,966 54,441 120,181 92,237<br />
Expected return on plan assets (651,709) (50,375) (97,571) - - (721,974) (48,929) (104,336) - -<br />
Recognition of prior service cost - - - - 236,235 - - - - 158,412<br />
Actuarial (gains) / losses (150,147) 4,788 (8,379) (32,133) 169,548 (171,586) 5,836 (14,796) (28,865) 128,225<br />
Return allocated to other funds 36.8.1 284,869 - - - - 302,709 - - - -<br />
Employees' contribution - - (4,618) - - - - (5,096) - -<br />
(350,963) 73,876 (55,591) 81,297 548,507 (410,926) 71,743 (64,724) 96,810 423,268<br />
36.8.1<br />
This represents return allocated to those employees who exercised the conversion option offered in the year 2001, as referred to in note 5.10.1.<br />
36.9 Actual return on plan assets<br />
Amongst the defined benefit plans, the pension, gratuity and benevolent fund plans are funded. The actual returns earned on the assets during the year are:<br />
Pension<br />
fund<br />
Gratuity<br />
fund<br />
2012<br />
Benevolent<br />
fund<br />
Post<br />
retirement<br />
medical<br />
benefit<br />
Employee<br />
compensated<br />
absences<br />
Pension<br />
fund<br />
Gratuity<br />
fund<br />
2011<br />
Benevolent<br />
fund<br />
Post<br />
retirement<br />
medical<br />
benefit<br />
Employee<br />
compensated<br />
absences<br />
------------------------------------------------------------------------ (Rupees in '000) ------------------------------------------------------------------------<br />
Expected return on plan assets 651,709 50,375 97,571 - - 721,974 48,929 104,336 - -<br />
Actuarial gain / (loss) on plan assets 29,092 (3,211) (2,934) - - 175 (993) (9,720) - -<br />
Actual return on plan assets 680,801 47,164 94,637 - - 722,149 47,936 94,616 - -<br />
36