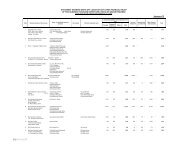
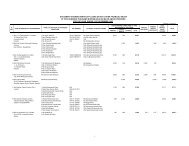
NOTES TO AND FORMING PART OF THE UNCONSOLIDATED FINANCIAL STATEMENTS FOR THE YEAR ENDED DECEMBER 31, 2012 36.10 Five year data on surplus / (deficit) of the plans and experience adjustments Pension Fund 2012 2011 2010 2009 2008 ---------------------------------- (Rupees in '000) ---------------------------------- Present value of defined benefit obligations (3,537,429) (3,671,958) (3,598,231) (3,585,208) (3,625,280) Fair value of plan assets 5,137,979 5,477,630 5,527,239 6,107,212 6,526,828 Surplus 1,600,550 1,805,672 1,929,008 2,522,004 2,901,548 Experience adjustments on plan liabilities [loss / (gain)] 11,271 (13,450) (214,828) 89,216 (87,141) Experience adjustments on plan assets [loss / (gain)] (29,096) 23,879 57,726 (282,376) (1,195) Gratuity Fund Present value of defined benefit obligations (523,053) (472,157) (417,733) (365,292) (384,786) Fair value of plan assets 409,974 381,841 325,781 301,174 291,292 Deficit (113,079) (90,316) (91,952) (64,118) (93,494) Experience adjustments on plan liabilities [loss / (gain)] (28,098) (4,001) 36,338 137,106 43,905 Experience adjustments on plan assets [loss / (gain)] 3,602 8,063 6,400 96,896 55,290 Benevolent Fund Present value of defined benefit obligations (409,721) (424,851) (420,778) (459,080) (529,647) Fair value of plan assets 836,962 827,840 799,917 796,302 739,180 Surplus 427,241 402,989 379,139 337,222 209,533 Experience adjustments on plan liabilities [loss / (gain)] (4,034) 4,886 1,505 (8,798) 138,712 Experience adjustments on plan assets [loss / (gain)] 1,473 20,826 2,737 (56,670) 144,550 Post retirement medical benefit Present value of defined benefit obligations (943,927) (831,508) (826,088) (852,603) (875,509) Experience adjustments on plan liabilities [loss / (gain)] 99,652 (34,740) (26,232) 37,473 761 Employee compensated absences Present value of defined benefit obligations 1,067,421 825,137 677,152 731,908 613,602 36.11 Effects of a 1% movement in assumed medical cost trend rates The annual medical expense entitlement is based on the non-monetized basic pay of employees as on June 30, 2001. Accordingly, movements in medical cost trend rates would not affect current service cost, interest cost and defined benefit obligations for the post retirement medical benefit scheme. 36.12 Components of plan assets as a percentage of total plan assets Pension fund 2012 2011 Gratuity Benevolent Pension Gratuity fund fund fund fund Benevolent fund Government securities 86.69% 95.00% 94.27% 89.02% 98.00% 96.47% Units of mutual funds 0.00% 0.00% 0.00% 0.00% 0.00% 0.00% Ordinary shares of listed companies 1.15% 0.89% 1.24% 0.68% 0.60% 1.23% Term finance certificates 10.72% 3.36% 1.84% 10.27% 0.69% 2.29% Others (including bank balances) 1.44% 0.75% 2.65% 0.03% 0.71% 0.01% 100.00% 100.00% 100.00% 100.00% 100.00% 100.00% As per actuarial recommendations, the expected return on plan assets was assumed at 12% per annum on Pension Fund assets, Gratuity Fund assets and Benevolent Fund assets. The expected return on plan assets was determined by considering the expected returns available on the underlying assets. 36.13 Expected contributions to be paid to the funds in the next financial year The <strong>Bank</strong> contributes to the pension and gratuity funds according to the actuary's advice. Contribution to the benevolent fund is made by the <strong>Bank</strong> as per the rates set out in the benevolent fund scheme. Based on actuarial advice, the management estimates that the charge / (reversal) in respect of defined benefit plans for the year ended December 31, 2013, subject to the provisions of the Trust Deeds, would be as follows: Pension fund Gratuity fund 2013 Benevolent fund Post retirement medical benefit Employee compensated absences ---------------------------------- (Rupees in '000) ---------------------------------- Expected (reversal) / charge for the year (170,393) 80,064 (46,697) 118,736 367,096 37. OTHER EMPLOYEE BENEFITS 37.1 Defined contribution plan The <strong>Bank</strong> operates a contributory provident fund scheme for 6,645 (2011: 5,438) employees who are not in the pension scheme. The employer and employee each contribute 8.33% of the basic salary to the funded scheme every month. 37.2 Employee Motivation and Retention Scheme The <strong>Bank</strong> has a long term motivation and retention scheme for its employees. The liability of the <strong>Bank</strong> in respect of the scheme for each year, if any, is fixed, and is accounted for in the year to which the scheme relates. The scheme is managed by separate Trusts formed in respect of each year. During the year, Rs.290.612 million (2011: Rs.170.563 million) and Rs.30.796 million (2011: Rs.24.528 million) were received by the Executives and the Chief Executive respectively from the scheme. 37.3 Benazir Employees’ Stock Option Scheme On August 14, 2009, the Government of Pakistan (GoP) launched the Benazir Employees' Stock Option Scheme ("the Scheme") for employees of certain State Owned Enterprises (SOEs) and non-SOEs. The Scheme needs to be accounted for by the covered entities, including the <strong>Bank</strong>, under the provisions of amended IFRS 2, Share Based Payments. However, keeping in view the difficulties that may be faced by the entities covered under the Scheme, the SECP has granted exemption to such entities from the application of IFRS 2 to the Scheme. Had the exemption not been granted, the staff costs of the <strong>Bank</strong> for the year would have been higher by Rs.583 million (2011: Rs.114 million), profit before taxation would have been lower by Rs.583 million (2011: Rs.114 million), unappropriated profit would have been lower by Rs.1,279 million (2011: Rs.696 million) and reserves would have been higher by Rs.1,279 million (2011: Rs.696 million), hence, there would have been no impact on net equity. Further, earnings per share would have been lower by Rs.0.48 per share (2011: Rs.0.09 per share). 37
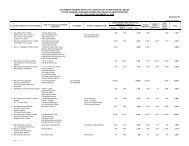
NOTES TO AND FORMING PART OF THE UNCONSOLIDATED FINANCIAL STATEMENTS FOR THE YEAR ENDED DECEMBER 31, 2012 38. COMPENSATION OF DIRECTORS AND EXECUTIVES President / Chief Executive Directors Executives 2012 2011 2012 2011 2012 2011 ------------------------------------------ (Rupees in '000) ----------------------------------------- Fees - - 34,133 34,553 - - Managerial remuneration 83,526 67,783 - - 3,384,117 2,858,140 - Charge for defined benefit plans 1,457 1,243 - - 301,221 254,073 Charge for defined contribution plan 2,263 2,030 - - 71,479 64,156 Rent and house maintenance 3,607 3,623 - - 454,066 448,887 Utilities 847 901 - - 222,226 199,352 Medical 21 234 - - 101,009 90,637 Conveyance - - - - 324,243 334,846 Others 6,203 6,510 - - 169,342 152,300 97,924 82,324 34,133 34,553 5,027,703 4,402,391 Number of persons 1 1 8 8 1,456 1,353 The <strong>Bank</strong>'s President / Chief Executive Officer and certain Executives are provided with free use of <strong>Bank</strong> maintained cars and household equipment. In addition to the above, all Executives including the Chief Executive Officer of the <strong>Bank</strong>, are also entitled to certain short and long term employee benefits which are disclosed in notes 36 and 37 to these financial statements. 39. FAIR VALUE OF FINANCIAL INSTRUMENTS The fair value of quoted investments other than those classified as held to maturity is based on quoted market price. The fair value of unquoted equity investments, other than investments in associates and subsidiaries, is determined on the basis of the break-up value of these investments as per their latest available audited financial statements. The fair value of fixed term loans, other assets, other liabilities and fixed term deposits cannot be calculated with sufficient reliability due to the absence of a current and active market for these assets and liabilities and reliable data regarding market rates for similar instruments. In the opinion of the management, the fair value of the remaining financial assets and liabilities are not significantly different from their carrying values since these are either short-term in nature or, in the case of customer loans and deposits, are frequently repriced. 38