Financial Statements - United Bank Limited
Financial Statements - United Bank Limited
Financial Statements - United Bank Limited

You also want an ePaper? Increase the reach of your titles
YUMPU automatically turns print PDFs into web optimized ePapers that Google loves.
NOTES TO AND FORMING PART OF THE UNCONSOLIDATED FINANCIAL STATEMENTS<br />
FOR THE YEAR ENDED DECEMBER 31, 2012<br />
44.4 Liquidity risk<br />
Liquidity risk is the risk that the <strong>Bank</strong> may be unable to meet its obligations or to fund increases in assets as they fall due without incurring unacceptable cost or losses.<br />
The Assets and Liability Management Committee (ALCO) of the <strong>Bank</strong> has the responsibility for the formulation of overall strategy and oversight of liquidity management and meets on a monthly basis or more frequently, if<br />
required.<br />
The <strong>Bank</strong>’s approach to liquidity management is to ensure, as far as possible, that it will always have sufficient liquidity to meet its liabilities when due, under both normal and stressed conditions, without incurring unacceptable<br />
losses or risking sustained damage to business franchises. A centralized approach is adopted, based on an integrated framework incorporating an assessment of all material known and expected cash flows and the availability of<br />
collateral which could be used to secure additional funding if required. The framework entails careful monitoring and control of the daily liquidity position, and regular liquidity stress testing under a variety of scenarios. These<br />
encompass both normal and stressed market conditions, including general market crises and the possibility that access to markets could be impacted by a stress event affecting some part of the <strong>Bank</strong>’s business.<br />
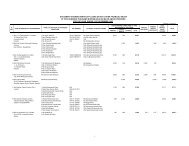
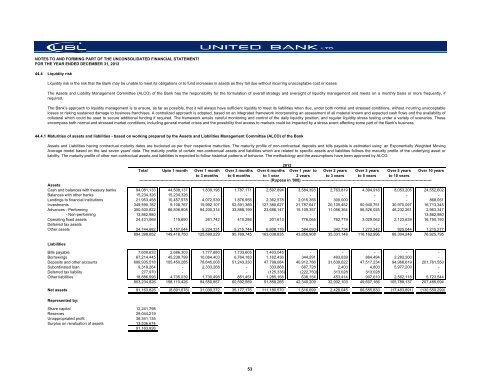
44.4.1 Maturities of assets and liabilities - based on working prepared by the Assets and Liabilities Management Committee (ALCO) of the <strong>Bank</strong><br />
Assets and Liabilities having contractual maturity dates are bucketed as per their respective maturities. The maturity profile of non-contractual deposits and bills payable is estimated using an Exponentially Weighted Moving<br />
Average model based on the last seven years' data. The maturity profile of certain non-contractual assets and liabilities which are related to specific assets and liabilities follows the maturity profile of the underlying asset or<br />
liability. The maturity profile of other non-contractual assets and liabilities is expected to follow historical patterns of behavior. The methodology and the assumptions have been approved by ALCO.<br />
2012<br />
Total Upto 1 month Over 1 month Over 3 months Over 6 months Over 1 year to Over 2 years Over 3 years Over 5 years Over 10 years<br />
to 3 months to 6 months to 1 year 2 years to 3 years to 5 years to 10 years<br />
--------------------------------------------------------------------------------------------------- (Rupees in '000) ---------------------------------------------------------------------------------------------------<br />
Assets<br />
Cash and balances with treasury banks 94,081,133 44,508,137 1,839,196 1,787,171 2,597,694 3,584,393 2,763,819 4,394,916 8,053,205 24,552,602<br />
Balances with other banks 15,234,326 15,234,326 - - - - - - - -<br />
Lendings to financial institutions 21,953,458 10,457,978 4,072,539 1,876,956 2,362,578 2,015,356 300,000 - - 868,051<br />
Investments 349,590,182 9,108,767 19,992,107 52,591,389 127,380,627 21,787,647 20,105,452 50,940,751 30,970,097 16,713,345<br />
Advances - Performing 350,500,822 66,836,808 94,200,314 33,888,199 23,688,147 15,109,357 11,056,364 56,526,025 46,232,261 2,963,347<br />
Advances - Non-performing 13,862,980 - - - - - - - - 13,862,980<br />
Operating fixed assets 24,431,069 115,690 261,742 410,286 201,613 776,065 762,779 3,029,062 2,123,639 16,750,193<br />
Deferred tax assets - - - - - - - - - -<br />
Other assets 24,744,682 3,157,044 5,224,331 5,215,744 6,808,176 584,090 342,734 1,272,242 925,044 1,215,277<br />
894,398,652 149,418,750 125,590,229 95,769,745 163,038,835 43,856,908 35,331,148 116,162,996 88,304,246 76,925,795<br />
Liabilities<br />
Bills payable 7,600,633 2,686,303 1,777,680 1,733,605 1,403,045 - - - - -<br />
Borrowings 67,214,445 45,238,799 10,064,403 6,764,183 1,162,436 344,291 493,639 864,494 2,282,200 -<br />
Deposits and other accounts 699,935,518 105,450,285 78,645,008 51,243,330 47,799,084 40,912,786 31,639,622 47,517,234 94,966,619 201,761,550<br />
Subordinated loan 9,319,264 - 2,333,268 - 333,868 667,728 2,400 4,800 5,977,200 -<br />
Deferred tax liability 277,970 - - - (125,336) (222,750) 313,028 313,028 - -<br />
Other liabilities 18,886,996 4,735,039 1,730,498 851,451 1,285,168 638,154 453,414 907,610 2,562,118 5,723,544<br />
803,234,826 158,110,426 94,550,857 60,592,569 51,858,265 42,340,209 32,902,103 49,607,166 105,788,137 207,485,094<br />
Net assets 91,163,826 (8,691,676) 31,039,372 35,177,176 111,180,570 1,516,699 2,429,045 66,555,830 (17,483,891) (130,559,299)<br />
Represented by:<br />
Share capital 12,241,798<br />
Reserves 29,044,219<br />
Unappropriated profit 36,341,135<br />
Surplus on revaluation of assets 13,536,674<br />
91,163,826<br />
53