Financial Statements - United Bank Limited
Financial Statements - United Bank Limited
Financial Statements - United Bank Limited

Create successful ePaper yourself
Turn your PDF publications into a flip-book with our unique Google optimized e-Paper software.
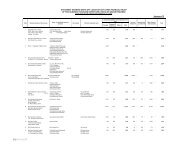
NOTES TO AND FORMING PART OF THE UNCONSOLIDATED FINANCIAL STATEMENTS<br />
FOR THE YEAR ENDED DECEMBER 31, 2012<br />
2011<br />
Gross advances Deposits Contingencies and<br />
commitments<br />
(Rupees in '000) Percent (Rupees in '000) Percent (Rupees in '000) Percent<br />
Chemical and pharmaceuticals 5,956,280 1.63% 6,585,168 1.07% 3,250,238 0.61%<br />
Agri business 47,098,763 12.86% 42,150,054 6.88% 59,505 0.01%<br />
Textile spinning 15,015,949 4.10% 975,609 0.16% 1,001,370 0.19%<br />
Textile weaving 8,322,335 2.27% 1,043,165 0.17% 783,030 0.15%<br />
Textile composite 24,024,679 6.56% 319,769 0.05% 199,997 0.04%<br />
Textile others 12,328,906 3.37% 3,679,286 0.60% 2,922,216 0.55%<br />
Cement 4,502,596 1.23% 1,674,669 0.27% 1,006,931 0.19%<br />
Sugar 7,126,082 1.95% 3,574,065 0.58% 28,939 0.01%<br />
Shoes and leather garments 2,261,079 0.62% 3,273,864 0.53% 178,949 0.03%<br />
Automobile and transportation equipment 5,019,017 1.37% 3,875,871 0.63% 2,951,532 0.55%<br />
<strong>Financial</strong> 12,282,190 3.35% 12,957,945 2.11% 302,414,636 56.63%<br />
Insurance - - 17,048,287 2.78% 7,438 0.00%<br />
Electronics and electrical appliances 2,645,758 0.72% 3,527,863 0.58% 831,435 0.16%<br />
Production and transmission of energy 41,158,790 11.24% 17,177,054 2.80% 20,945,901 3.92%<br />
Paper and allied 1,374,357 0.38% 1,762,145 0.29% 623,438 0.12%<br />
Surgical and metal 335,641 0.09% 3,539,760 0.58% 58,810 0.01%<br />
Contractors 8,167,991 2.23% 18,465,596 3.01% 22,860,205 4.28%<br />
Wholesale traders 13,784,426 3.76% 41,776,985 6.82% 3,342,661 0.63%<br />
Fertilizer dealers 6,870,880 1.88% 11,698,466 1.91% 429,624 0.08%<br />
Sports goods 356,647 0.10% 1,679,032 0.27% 36,154 0.01%<br />
Food industries 8,992,044 2.45% 7,192,939 1.17% 3,876,565 0.73%<br />
Airlines 5,173,722 1.41% 414,250 0.07% 72,829 0.01%<br />
Cables 551,500 0.15% 65,054 0.01% 328,151 0.06%<br />
Construction 17,972,549 4.91% 12,107,200 1.98% 6,643,268 1.24%<br />
Containers and ports 1,762,702 0.48% 8,432,724 1.38% 3,430,024 0.64%<br />
Engineering 1,068,788 0.29% 3,467,976 0.57% 2,185,733 0.41%<br />
Glass and allied 150,762 0.04% 929,968 0.15% 76,524 0.01%<br />
Hotels 2,660,081 0.73% 3,861,057 0.63% 89,227 0.02%<br />
Infrastructure 714,286 0.19% 4,098,615 0.67% 9,365 0.00%<br />
Media 369,290 0.10% 206,796 0.03% 53,209 0.01%<br />
Polyester and fiber 2,734,383 0.75% 236,116 0.04% 155,848 0.03%<br />
Telecommunication 5,987,777 1.63% 6,489,672 1.06% 17,163,745 3.21%<br />
Individuals 50,088,570 13.67% 302,638,004 49.37% 23,245,742 4.35%<br />
Others 49,447,808 13.49% 66,055,115 10.78% 110,225,239 21.12%<br />
366,306,628 100.00% 612,980,139 100.00% 531,488,478 100.00%<br />
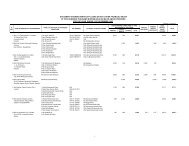
44.2.2 Segment by Sector<br />
2012<br />
Gross advances Deposits Contingencies and<br />
commitments<br />
(Rupees in '000) Percent (Rupees in '000) Percent (Rupees in '000) Percent<br />
Public / Government 105,576,001 25.81% 54,372,750 7.77% 117,283,647 22.84%<br />
Private 303,514,443 74.19% 645,562,768 92.23% 396,224,834 77.16%<br />
409,090,444 100.00% 699,935,518 100.00% 513,508,481 100.00%<br />
409,090,444 699,935,518<br />
2011<br />
Gross advances Deposits Contingencies and<br />
commitments<br />
(Rupees in '000) Percent (Rupees in '000) Percent (Rupees in '000) Percent<br />
Public / Government 62,708,253 17.12% 64,423,780 10.51% 70,842,557 13.27%<br />
Private 303,598,375 82.88% 548,556,359 89.49% 460,645,921 86.73%<br />
366,306,628 100.00% 612,980,139 100.00% 531,488,478 100.00%<br />
47