
You also want an ePaper? Increase the reach of your titles
YUMPU automatically turns print PDFs into web optimized ePapers that Google loves.
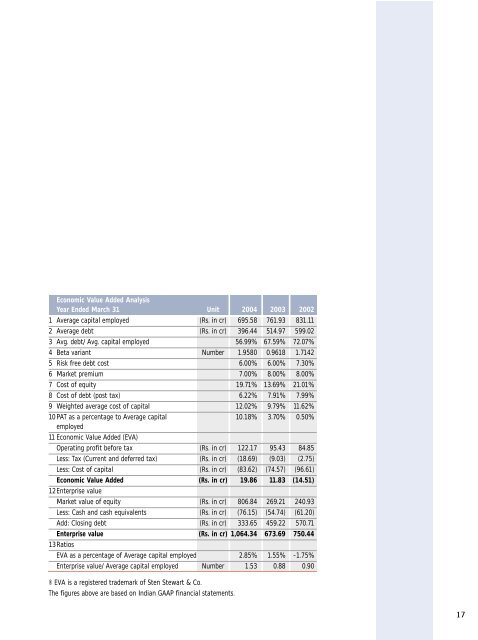
Economic Value Added Analysis<br />
Year Ended March 31 Unit <strong>2004</strong> <strong>2003</strong> 2002<br />
1 Average capital employed (Rs. in cr) 695.58 761.93 831.11<br />
2 Average debt (Rs. in cr) 396.44 514.97 599.02<br />
3 Avg. debt/ Avg. capital employed 56.99% 67.59% 72.07%<br />
4 Beta variant Number 1.9580 0.9618 1.7142<br />
5 Risk free debt cost 6.00% 6.00% 7.30%<br />
6 Market premium 7.00% 8.00% 8.00%<br />
7 Cost of equity 19.71% 13.69% 21.01%<br />
8 Cost of debt (post tax) 6.22% 7.91% 7.99%<br />
9 Weighted average cost of capital 12.02% 9.79% 11.62%<br />
10 PAT as a percentage to Average capital 10.18% 3.70% 0.50%<br />
employed<br />
11 Economic Value Added (EVA)<br />
Operating profit before tax (Rs. in cr) 122.17 95.43 84.85<br />
Less: Tax (Current and deferred tax) (Rs. in cr) (18.69) (9.03) (2.75)<br />
Less: Cost of capital (Rs. in cr) (83.62) (74.57) (96.61)<br />
Economic Value Added (Rs. in cr) 19.86 11.83 (14.51)<br />
12Enterprise value<br />
Market value of equity (Rs. in cr) 806.84 269.21 240.93<br />
Less: Cash and cash equivalents (Rs. in cr) (76.15) (54.74) (61.20)<br />
Add: Closing debt (Rs. in cr) 333.65 459.22 570.71<br />
Enterprise value (Rs. in cr) 1,064.34 673.69 750.44<br />
13Ratios<br />
EVA as a percentage of Average capital employed 2.85% 1.55% -1.75%<br />
Enterprise value/ Average capital employed Number 1.53 0.88 0.90<br />
® EVA is a registered trademark of Sten Stewart & Co.<br />
The figures above are based on Indian GAAP financial statements.<br />
17