MelbourneâBrisbane Inland Rail Alignment Study - Australian Rail ...
MelbourneâBrisbane Inland Rail Alignment Study - Australian Rail ...
MelbourneâBrisbane Inland Rail Alignment Study - Australian Rail ...

You also want an ePaper? Increase the reach of your titles
YUMPU automatically turns print PDFs into web optimized ePapers that Google loves.
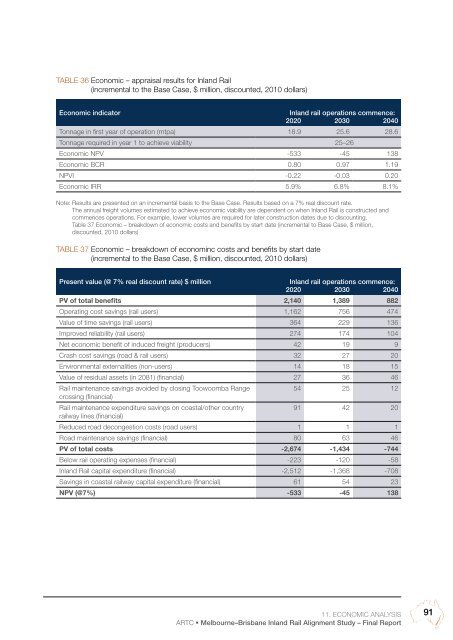
Table 36 Economic – appraisal results for <strong>Inland</strong> <strong>Rail</strong><br />
(incremental to the Base Case, $ million, discounted, 2010 dollars)<br />
Economic indicator<br />
<strong>Inland</strong> rail operations commence:<br />
2020 2030 2040<br />
Tonnage in first year of operation (mtpa) 18.9 25.6 28.6<br />
Tonnage required in year 1 to achieve viability 25–26<br />
Economic NPV -533 -45 138<br />
Economic BCR 0.80 0.97 1.19<br />
NPVI -0.22 -0.03 0.20<br />
Economic IRR 5.9% 6.8% 8.1%<br />
Note: Results are presented on an incremental basis to the Base Case. Results based on a 7% real discount rate.<br />
The annual freight volumes estimated to achieve economic viability are dependent on when <strong>Inland</strong> <strong>Rail</strong> is constructed and<br />
commences operations. For example, lower volumes are required for later construction dates due to discounting.<br />
Table 37 Economic – breakdown of economic costs and benefits by start date (incremental to Base Case, $ million,<br />
discounted, 2010 dollars)<br />
Table 37 Economic – breakdown of econominc costs and benefits by start date<br />
(incremental to the Base Case, $ million, discounted, 2010 dollars)<br />
Present value (@ 7% real discount rate) $ million<br />
<strong>Inland</strong> rail operations commence:<br />
2020 2030 2040<br />
PV of total benefits 2,140 1,389 882<br />
Operating cost savings (rail users) 1,162 756 474<br />
Value of time savings (rail users) 364 229 136<br />
Improved reliability (rail users) 274 174 104<br />
Net economic benefit of induced freight (producers) 42 19 9<br />
Crash cost savings (road & rail users) 32 27 20<br />
Environmental externalities (non-users) 14 18 15<br />
Value of residual assets (in 2081) (financial) 27 36 46<br />
<strong>Rail</strong> maintenance savings avoided by closing Toowoomba Range<br />
54 25 12<br />
crossing (financial)<br />
<strong>Rail</strong> maintenance expenditure savings on coastal/other country<br />
91 42 20<br />
railway lines (financial)<br />
Reduced road decongestion costs (road users) 1 1 1<br />
Road maintenance savings (financial) 80 63 46<br />
PV of total costs -2,674 -1,434 -744<br />
Below rail operating expenses (financial) -223 -120 -58<br />
<strong>Inland</strong> <strong>Rail</strong> capital expenditure (financial) -2,512 -1,368 -708<br />
Savings in coastal railway capital expenditure (financial) 61 54 23<br />
NPV (@7%) -533 -45 138<br />
11. Economic analysis<br />
ARTC • Melbourne–Brisbane <strong>Inland</strong> <strong>Rail</strong> <strong>Alignment</strong> <strong>Study</strong> – Final Report<br />
91