MelbourneâBrisbane Inland Rail Alignment Study - Australian Rail ...
MelbourneâBrisbane Inland Rail Alignment Study - Australian Rail ...
MelbourneâBrisbane Inland Rail Alignment Study - Australian Rail ...
You also want an ePaper? Increase the reach of your titles
YUMPU automatically turns print PDFs into web optimized ePapers that Google loves.
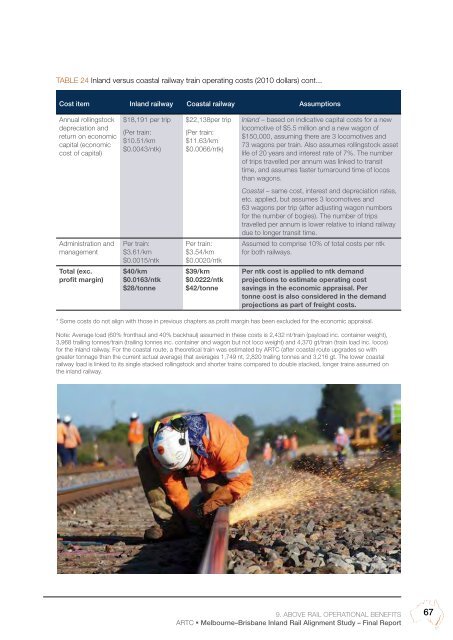
Table 24 <strong>Inland</strong> versus coastal railway train operating costs (2010 dollars) cont...<br />
Cost item <strong>Inland</strong> railway Coastal railway Assumptions<br />
Annual rollingstock<br />
depreciation and<br />
return on economic<br />
capital (economic<br />
cost of capital)<br />
$18,191 per trip<br />
(Per train:<br />
$10.51/km<br />
$0.0043/ntk)<br />
$22,138per trip<br />
(Per train:<br />
$11.63/km<br />
$0.0066/ntk)<br />
<strong>Inland</strong> – based on indicative capital costs for a new<br />
locomotive of $5.5 million and a new wagon of<br />
$150,000, assuming there are 3 locomotives and<br />
73 wagons per train. Also assumes rollingstock asset<br />
life of 20 years and interest rate of 7%. The number<br />
of trips travelled per annum was linked to transit<br />
time, and assumes faster turnaround time of locos<br />
than wagons.<br />
Coastal – same cost, interest and depreciation rates,<br />
etc. applied, but assumes 3 locomotives and<br />
63 wagons per trip (after adjusting wagon numbers<br />
for the number of bogies). The number of trips<br />
travelled per annum is lower relative to inland railway<br />
due to longer transit time.<br />
Assumed to comprise 10% of total costs per ntk<br />
for both railways.<br />
Administration and<br />
management<br />
Total (exc.<br />
profit margin)<br />
Per train:<br />
$3.61/km<br />
$0.0015/ntk<br />
$40/km<br />
$0.0163/ntk<br />
$28/tonne<br />
Per train:<br />
$3.54/km<br />
$0.0020/ntk<br />
$39/km<br />
$0.0222/ntk<br />
$42/tonne<br />
Per ntk cost is applied to ntk demand<br />
projections to estimate operating cost<br />
savings in the economic appraisal. Per<br />
tonne cost is also considered in the demand<br />
projections as part of freight costs.<br />
* Some costs do not align with those in previous chapters as profit margin has been excluded for the economic appraisal.<br />
Note: Average load (60% fronthaul and 40% backhaul) assumed in these costs is 2,432 nt/train (payload inc. container weight),<br />
3,968 trailing tonnes/train (trailing tonnes inc. container and wagon but not loco weight) and 4,370 gt/train (train load inc. locos)<br />
for the inland railway. For the coastal route, a theoretical train was estimated by ARTC (after coastal route upgrades so with<br />
greater tonnage than the current actual average) that averages 1,749 nt, 2,820 trailing tonnes and 3,216 gt. The lower coastal<br />
railway load is linked to its single stacked rollingstock and shorter trains compared to double stacked, longer trains assumed on<br />
the inland railway.<br />
9. Above rail operational benefits<br />
ARTC • Melbourne–Brisbane <strong>Inland</strong> <strong>Rail</strong> <strong>Alignment</strong> <strong>Study</strong> – Final Report<br />
67


