Post-16 Transitions: a Longitudinal Study of Young People with ...
Post-16 Transitions: a Longitudinal Study of Young People with ...
Post-16 Transitions: a Longitudinal Study of Young People with ...

You also want an ePaper? Increase the reach of your titles
YUMPU automatically turns print PDFs into web optimized ePapers that Google loves.
ackgrounds, followed by Black and mixed/other ethnic<br />
backgrounds (both two per cent). 1<br />
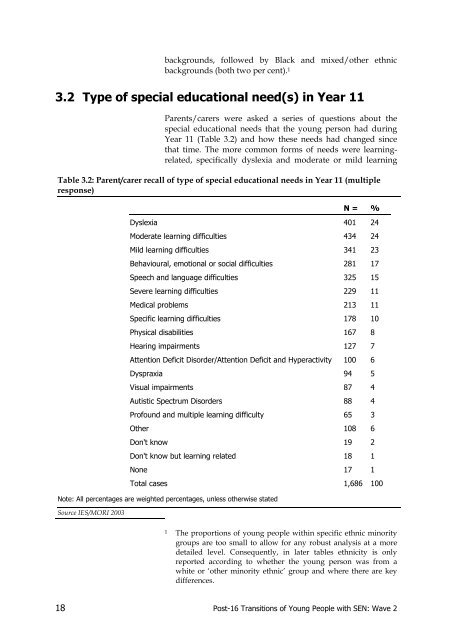
3.2 Type <strong>of</strong> special educational need(s) in Year 11<br />
Parents/carers were asked a series <strong>of</strong> questions about the<br />
special educational needs that the young person had during<br />
Year 11 (Table 3.2) and how these needs had changed since<br />
that time. The more common forms <strong>of</strong> needs were learningrelated,<br />
specifically dyslexia and moderate or mild learning<br />
Table 3.2: Parent/carer recall <strong>of</strong> type <strong>of</strong> special educational needs in Year 11 (multiple<br />
response)<br />
N = %<br />
Dyslexia 401 24<br />
Moderate learning difficulties 434 24<br />
Mild learning difficulties 341 23<br />
Behavioural, emotional or social difficulties 281 17<br />
Speech and language difficulties 325 15<br />
Severe learning difficulties 229 11<br />
Medical problems 213 11<br />
Specific learning difficulties 178 10<br />
Physical disabilities <strong>16</strong>7 8<br />
Hearing impairments 127 7<br />
Attention Deficit Disorder/Attention Deficit and Hyperactivity 100 6<br />
Dyspraxia 94 5<br />
Visual impairments 87 4<br />
Autistic Spectrum Disorders 88 4<br />
Pr<strong>of</strong>ound and multiple learning difficulty 65 3<br />
Other 108 6<br />
Don't know 19 2<br />
Don't know but learning related 18 1<br />
None 17 1<br />
Total cases 1,686 100<br />
Note: All percentages are weighted percentages, unless otherwise stated<br />
Source IES/MORI 2003<br />
1 The proportions <strong>of</strong> young people <strong>with</strong>in specific ethnic minority<br />
groups are too small to allow for any robust analysis at a more<br />
detailed level. Consequently, in later tables ethnicity is only<br />
reported according to whether the young person was from a<br />
white or ‘other minority ethnic’ group and where there are key<br />
differences.<br />
18 <strong>Post</strong>-<strong>16</strong> <strong>Transitions</strong> <strong>of</strong> <strong>Young</strong> <strong>People</strong> <strong>with</strong> SEN: Wave 2